Results Analysis: Cross-Tabulations
CROSS-TABULATE THE ANSWERS TO SEVERAL QUESTIONS
About Cross-Tabulations
Creating Cross-Tabulations while analyzing your survey results allows you to observe whether or not a correlation exists between responses (to several questions).
A Cross-Tabulation involves comparing the results obtained on two closed-ended questions. It is displayed in the form of a cross-table:
- The rows display the response options for the first question;
- The columns display the response options for the second question (referred to as the "variable").
For example, for a Cross-Tabulation between Q1 (rows) and Q2 (columns), the table will be structured as follows:
- In rows (Q1):
In rows (Q1): Row 1 = option 1 of Q1
Row 2 = option 2 of Q1
Row 3 = option 3 of Q1
...
- In columns (Q2):
Column 1 = option 1 of Q2
Column 2 = option 2 of Q2
Column 3 = option 3 of Q2
...
In each cell of the cross-table, the value corresponds to the sum of respondents who simultaneously selected a particular option in the first question AND a particular option in the second question.
Thus, for a Cross-Tabulation between Q1 (rows) and Q2 (columns), the value in the first cell of the table (row 1 / column 1) will correspond to the sum of respondents who selected:
- option 1 in Q1
- AND option 1 in Q2
For example, if we observe that 80 respondents selected both option 1 in Q1 AND option 1 in Q2, then the value in
the first cell of the Cross Table will be "80."
This value can also be expressed as a percentage (%).
Consider the following scenario: you conducted a survey for an online sunglasses sales project featuring trendy
frames.
You wish to verify whether there is a correlation between the age of the respondents and their interest in your
sunglasses project (e.g., you want to determine if your sunglasses appeals more to younger individuals).
By creating a Cross-Tabulation between the question about age (e.g., Q1) and the question about respondents’
interest in your sunglasses project (e.g., Q10), you will be able to directly observe if younger individuals are
indeed more interested in your project than others.
You can easily create Cross-Tabulations on the e-Survey platform from the "Results Analysis" tab.
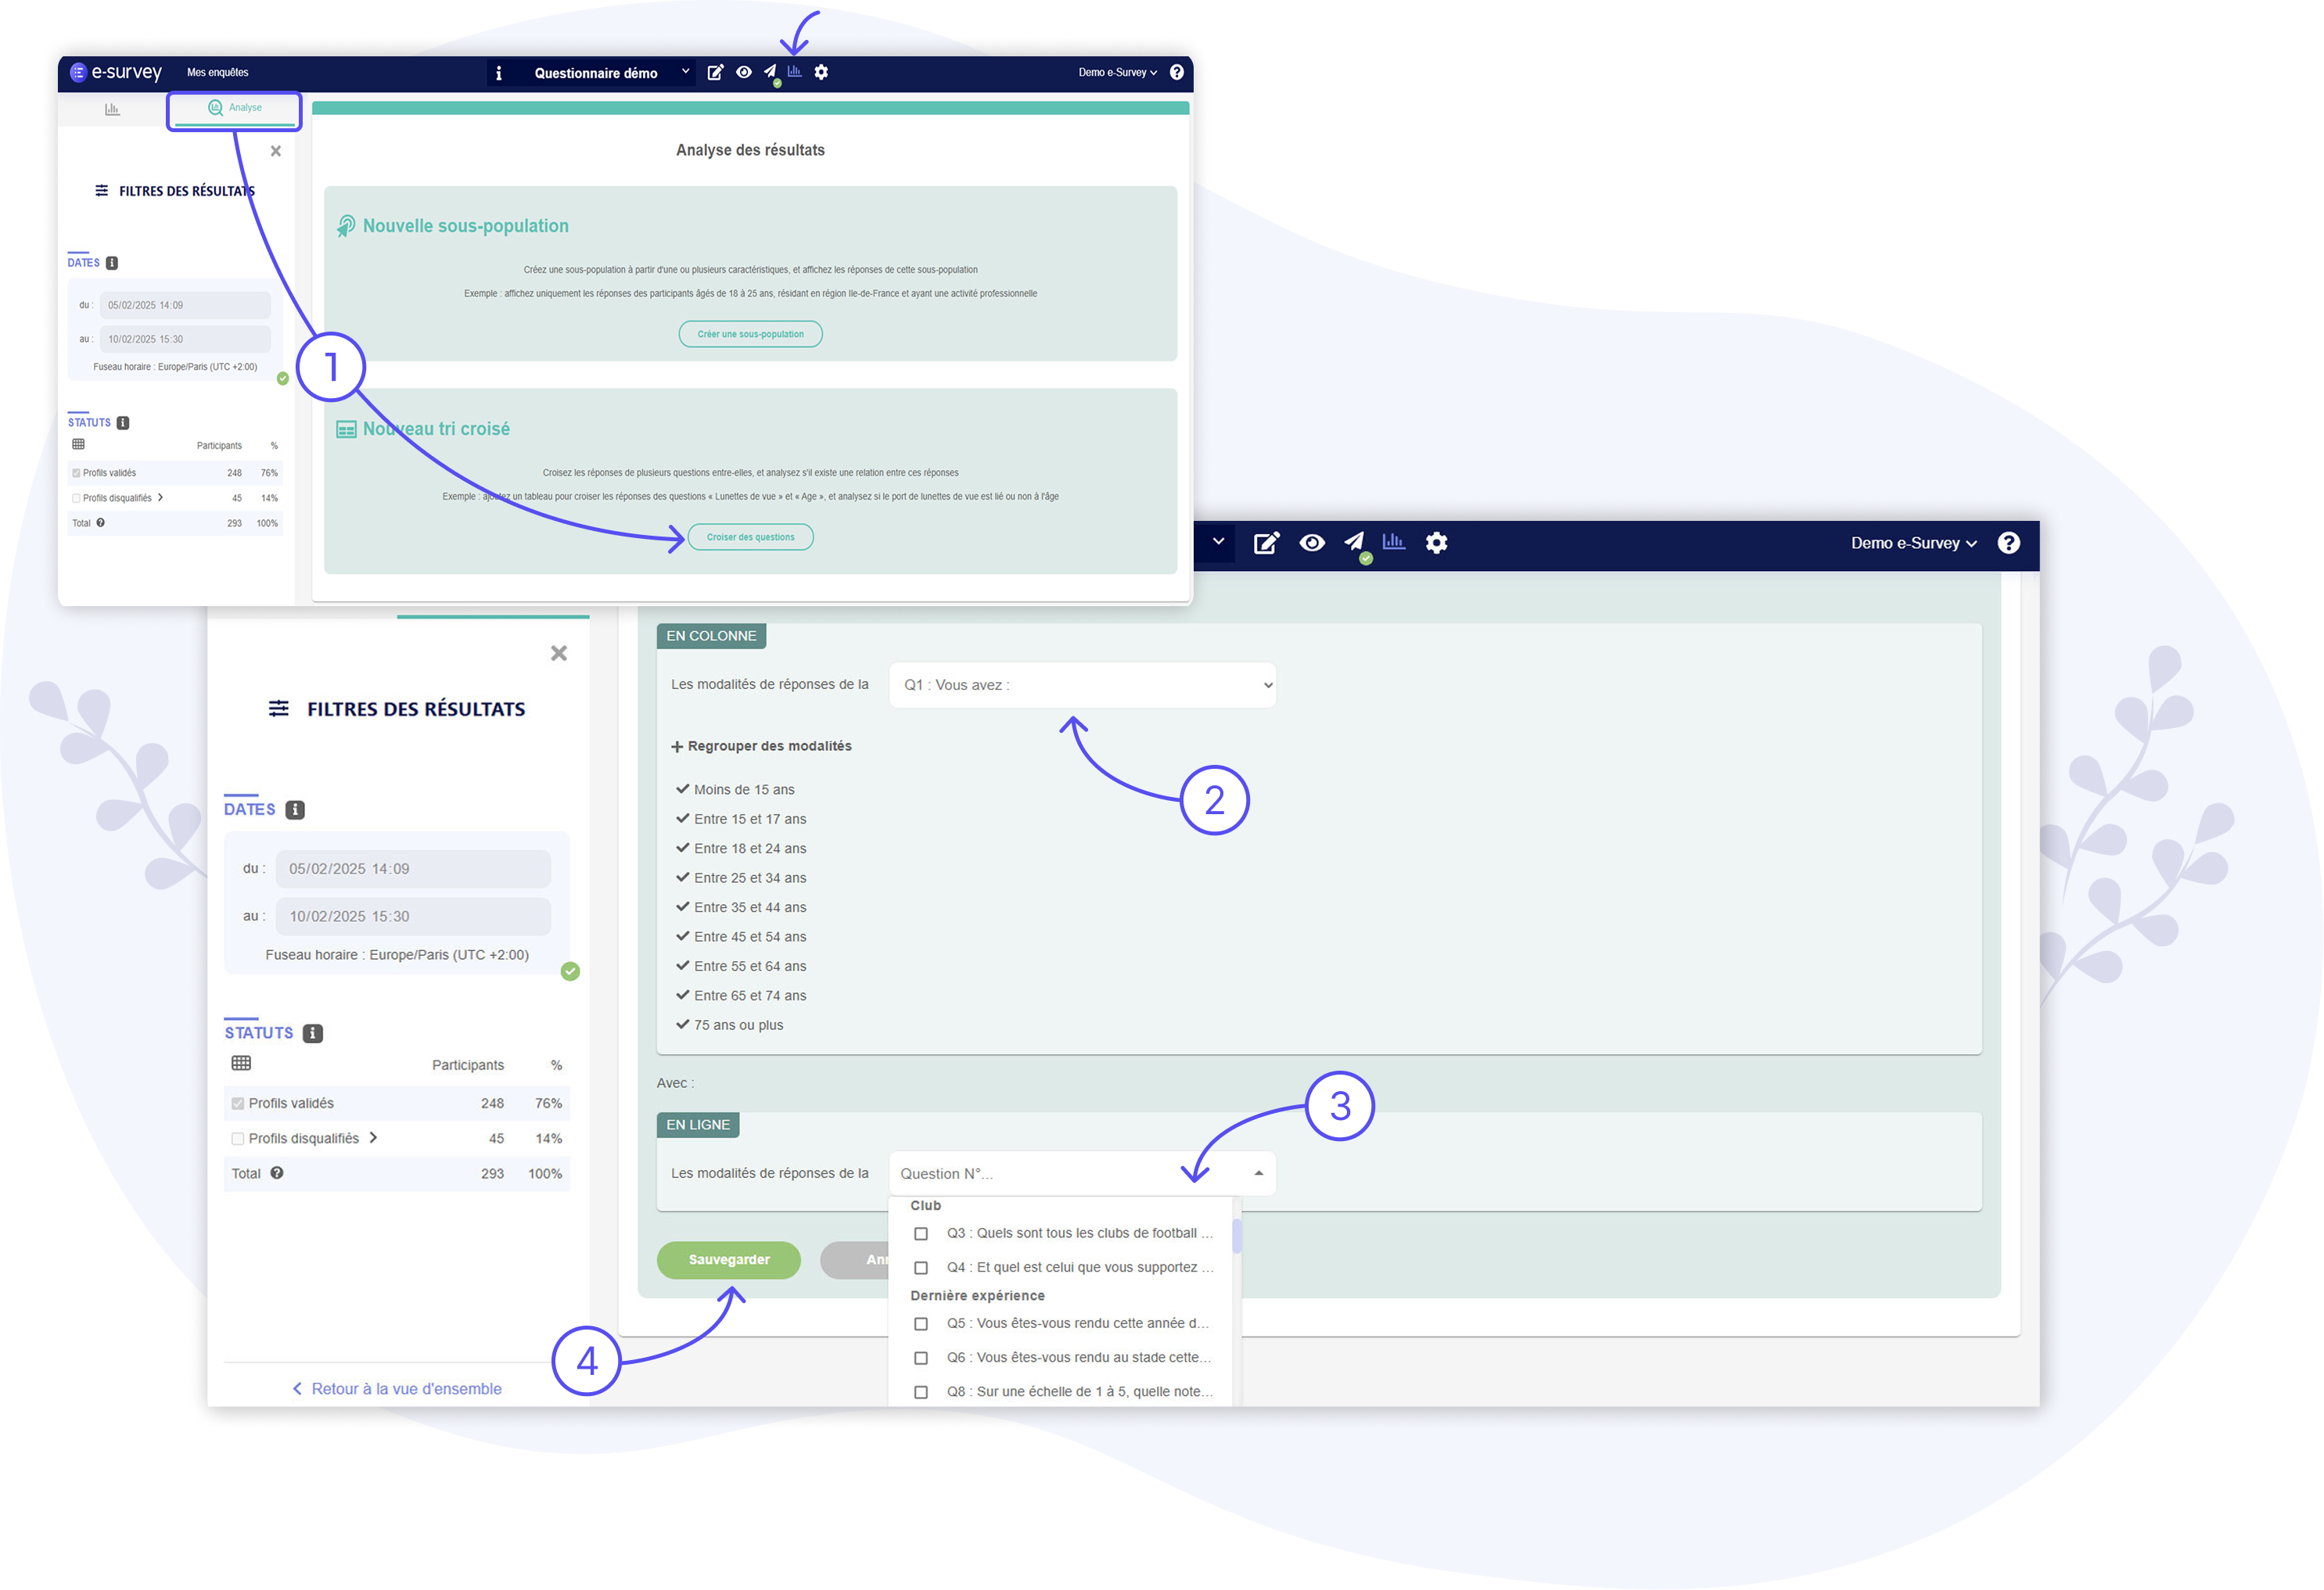
1 – Go to the "Results Analysis" tab and create a Cross-Tabulation
In the "Results Analysis" tab (or "Analysis"), you can both cross the responses of several questions with each other (Cross-Tabulations) and create sub-populations.
Click on the "Cross Questions" button to configure your first Cross-Tabulation.
Then select your "Variable" question (the question whose options will be displayed as columns in the table), and the question(s) you wish to cross with this variable.
Once the questions are selected and the Cross-Tabulation has been created, click the "Save" button at the bottom of the block.
Note:
A single Cross-Tabulation can generate several cross tables – this happens if you choose to cross the same question/variable (in columns) with several other questions (in rows).
For instance, if you decide to cross the variable Age (Q1) with 3 other questions (e.g., Q10, Q11, and Q12), this will generate 3 cross tables:
- Table 1 = Q10 crossed with the variable Age (Q1)
- Table 2 = Q11 crossed with the variable Age (Q1)
- Table 3 = Q12 crossed with the variable Age (Q1)
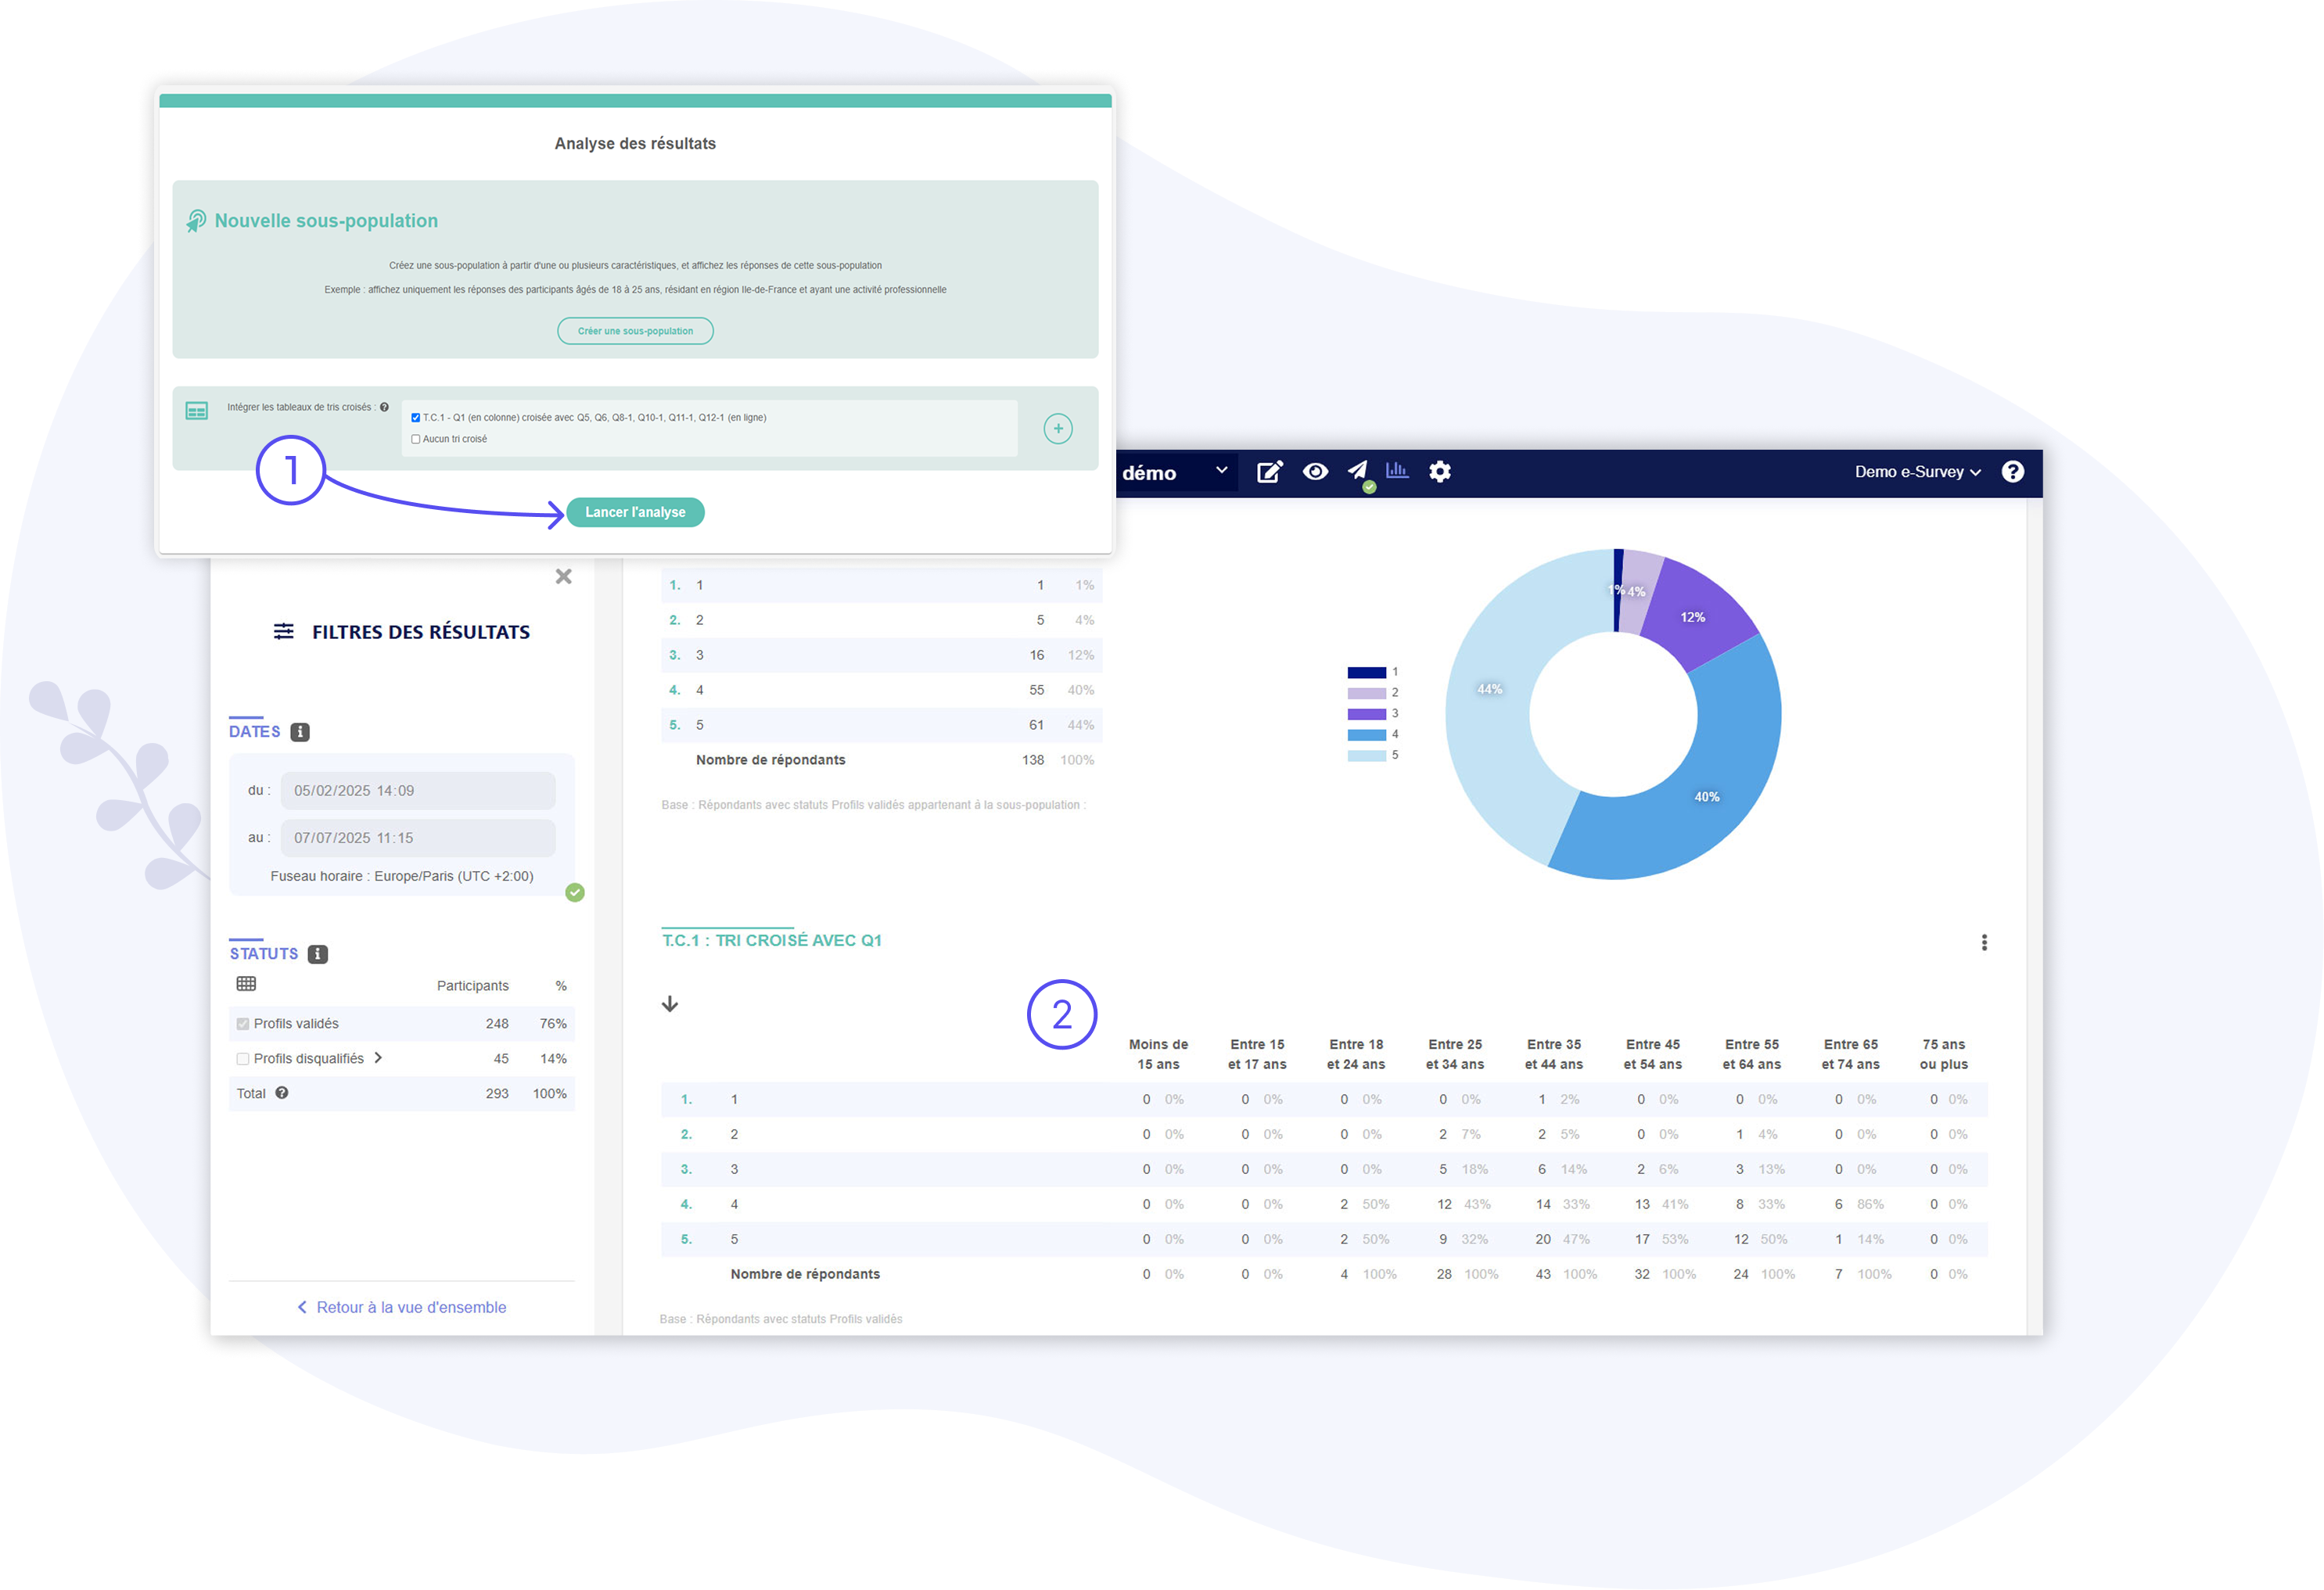
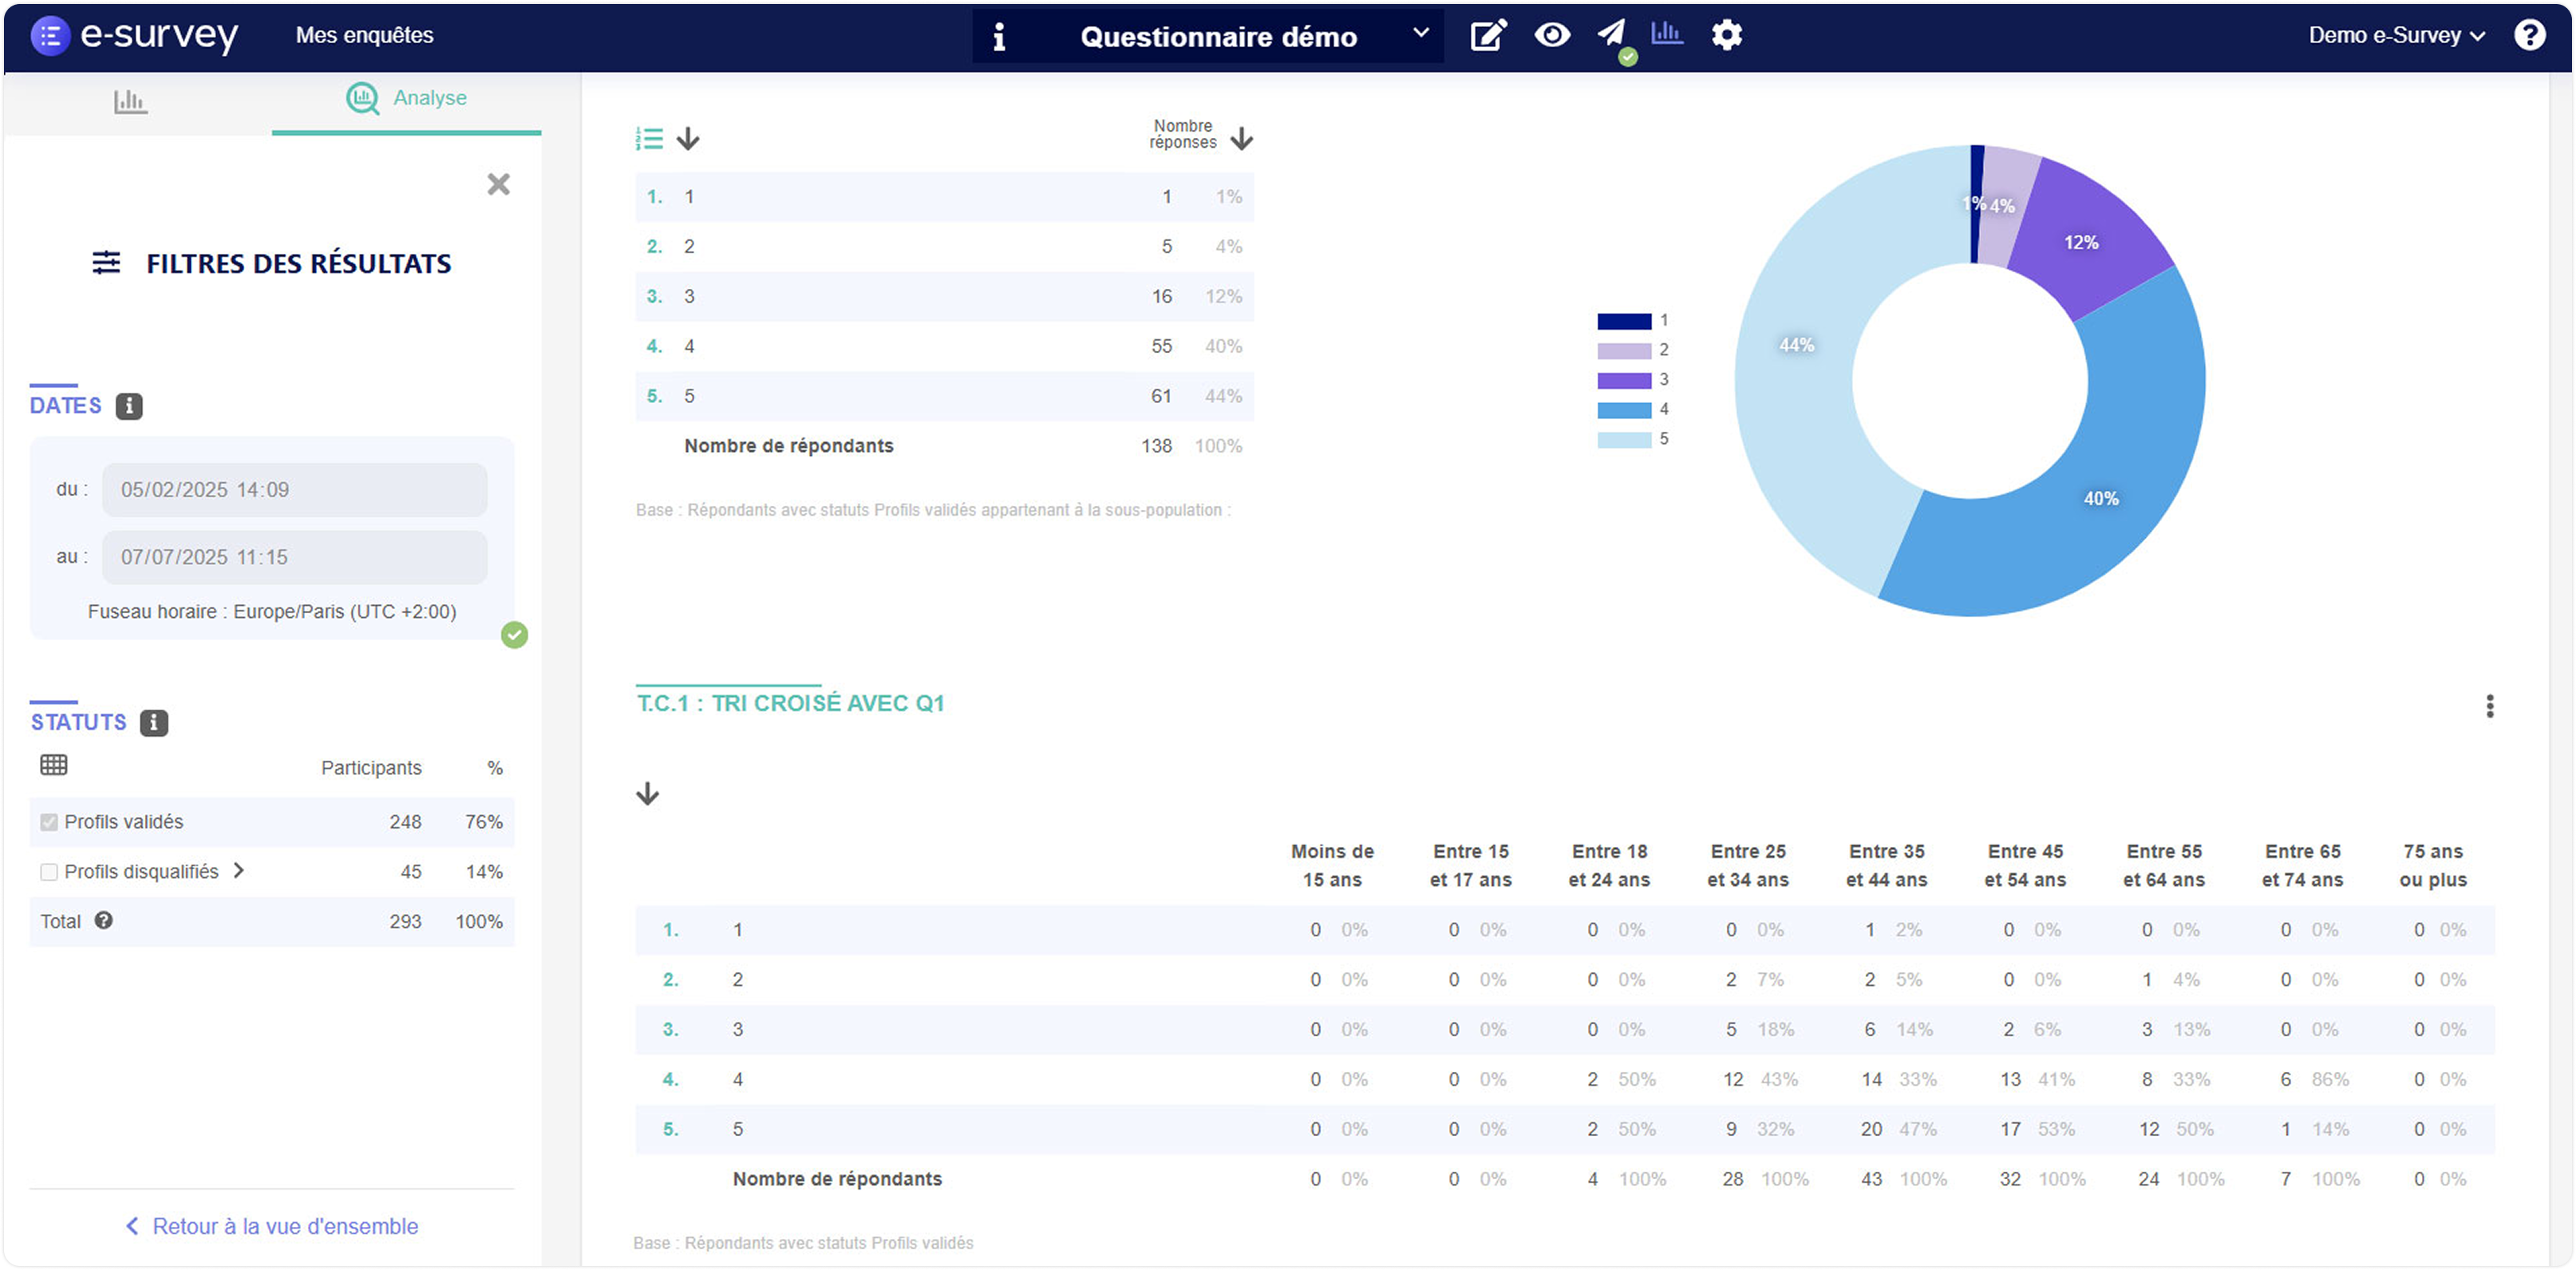
2 – Run the Analysis
Once the Cross-Tabulation has been created and saved, you can launch an analysis to display the results along with the cross table(s) by clicking the "Run Analysis" (or "Update Analysis") button.
When the analysis is launched, the cross table(s) load and display on the page, under the concerned question’s block (the question whose options are shown as rows in the table). More precisely, the cross table is positioned below the single-variable table and its graph.
It is also possible to create and run an analysis with multiple Cross-Tabulations at the same time.