Results Analysis: Sub-populations
FOCUS THE ANALYSIS ON ONE OR MORE SEGMENTS OF RESPONDENTS
About Sub-populations
Creating Sub-populations, when analyzing the results of your survey, allows you to focus on subsets of respondents.
A Sub-population will often correspond to a group of respondents defined by specific characteristics (e.g., socio-demographic characteristics, purchasing behaviors, etc.).
A Sub-population will often correspond to a group of respondents defined by specific characteristics (e.g., socio-demographic characteristics, purchasing behaviors, etc.).
Imagine the following scenario: you conducted a survey for an online sunglasses sales project featuring trendy
frames.
You have identified that your "target audience" (your principal customer base) consists of the following
profiles: Young people aged 25 to 34, active, and urban.
By creating a Sub-population corresponding precisely to these profiles, you will be able to extract their
responses in one click (along with tables, graphs, etc.), allowing you to conduct a specific analysis for this
segment of your clientele.
You can easily create Sub-populations on the e-Survey platform from the "Results Analysis" tab.
1 – Go to the "Results Analysis" tab and create a Sub-population
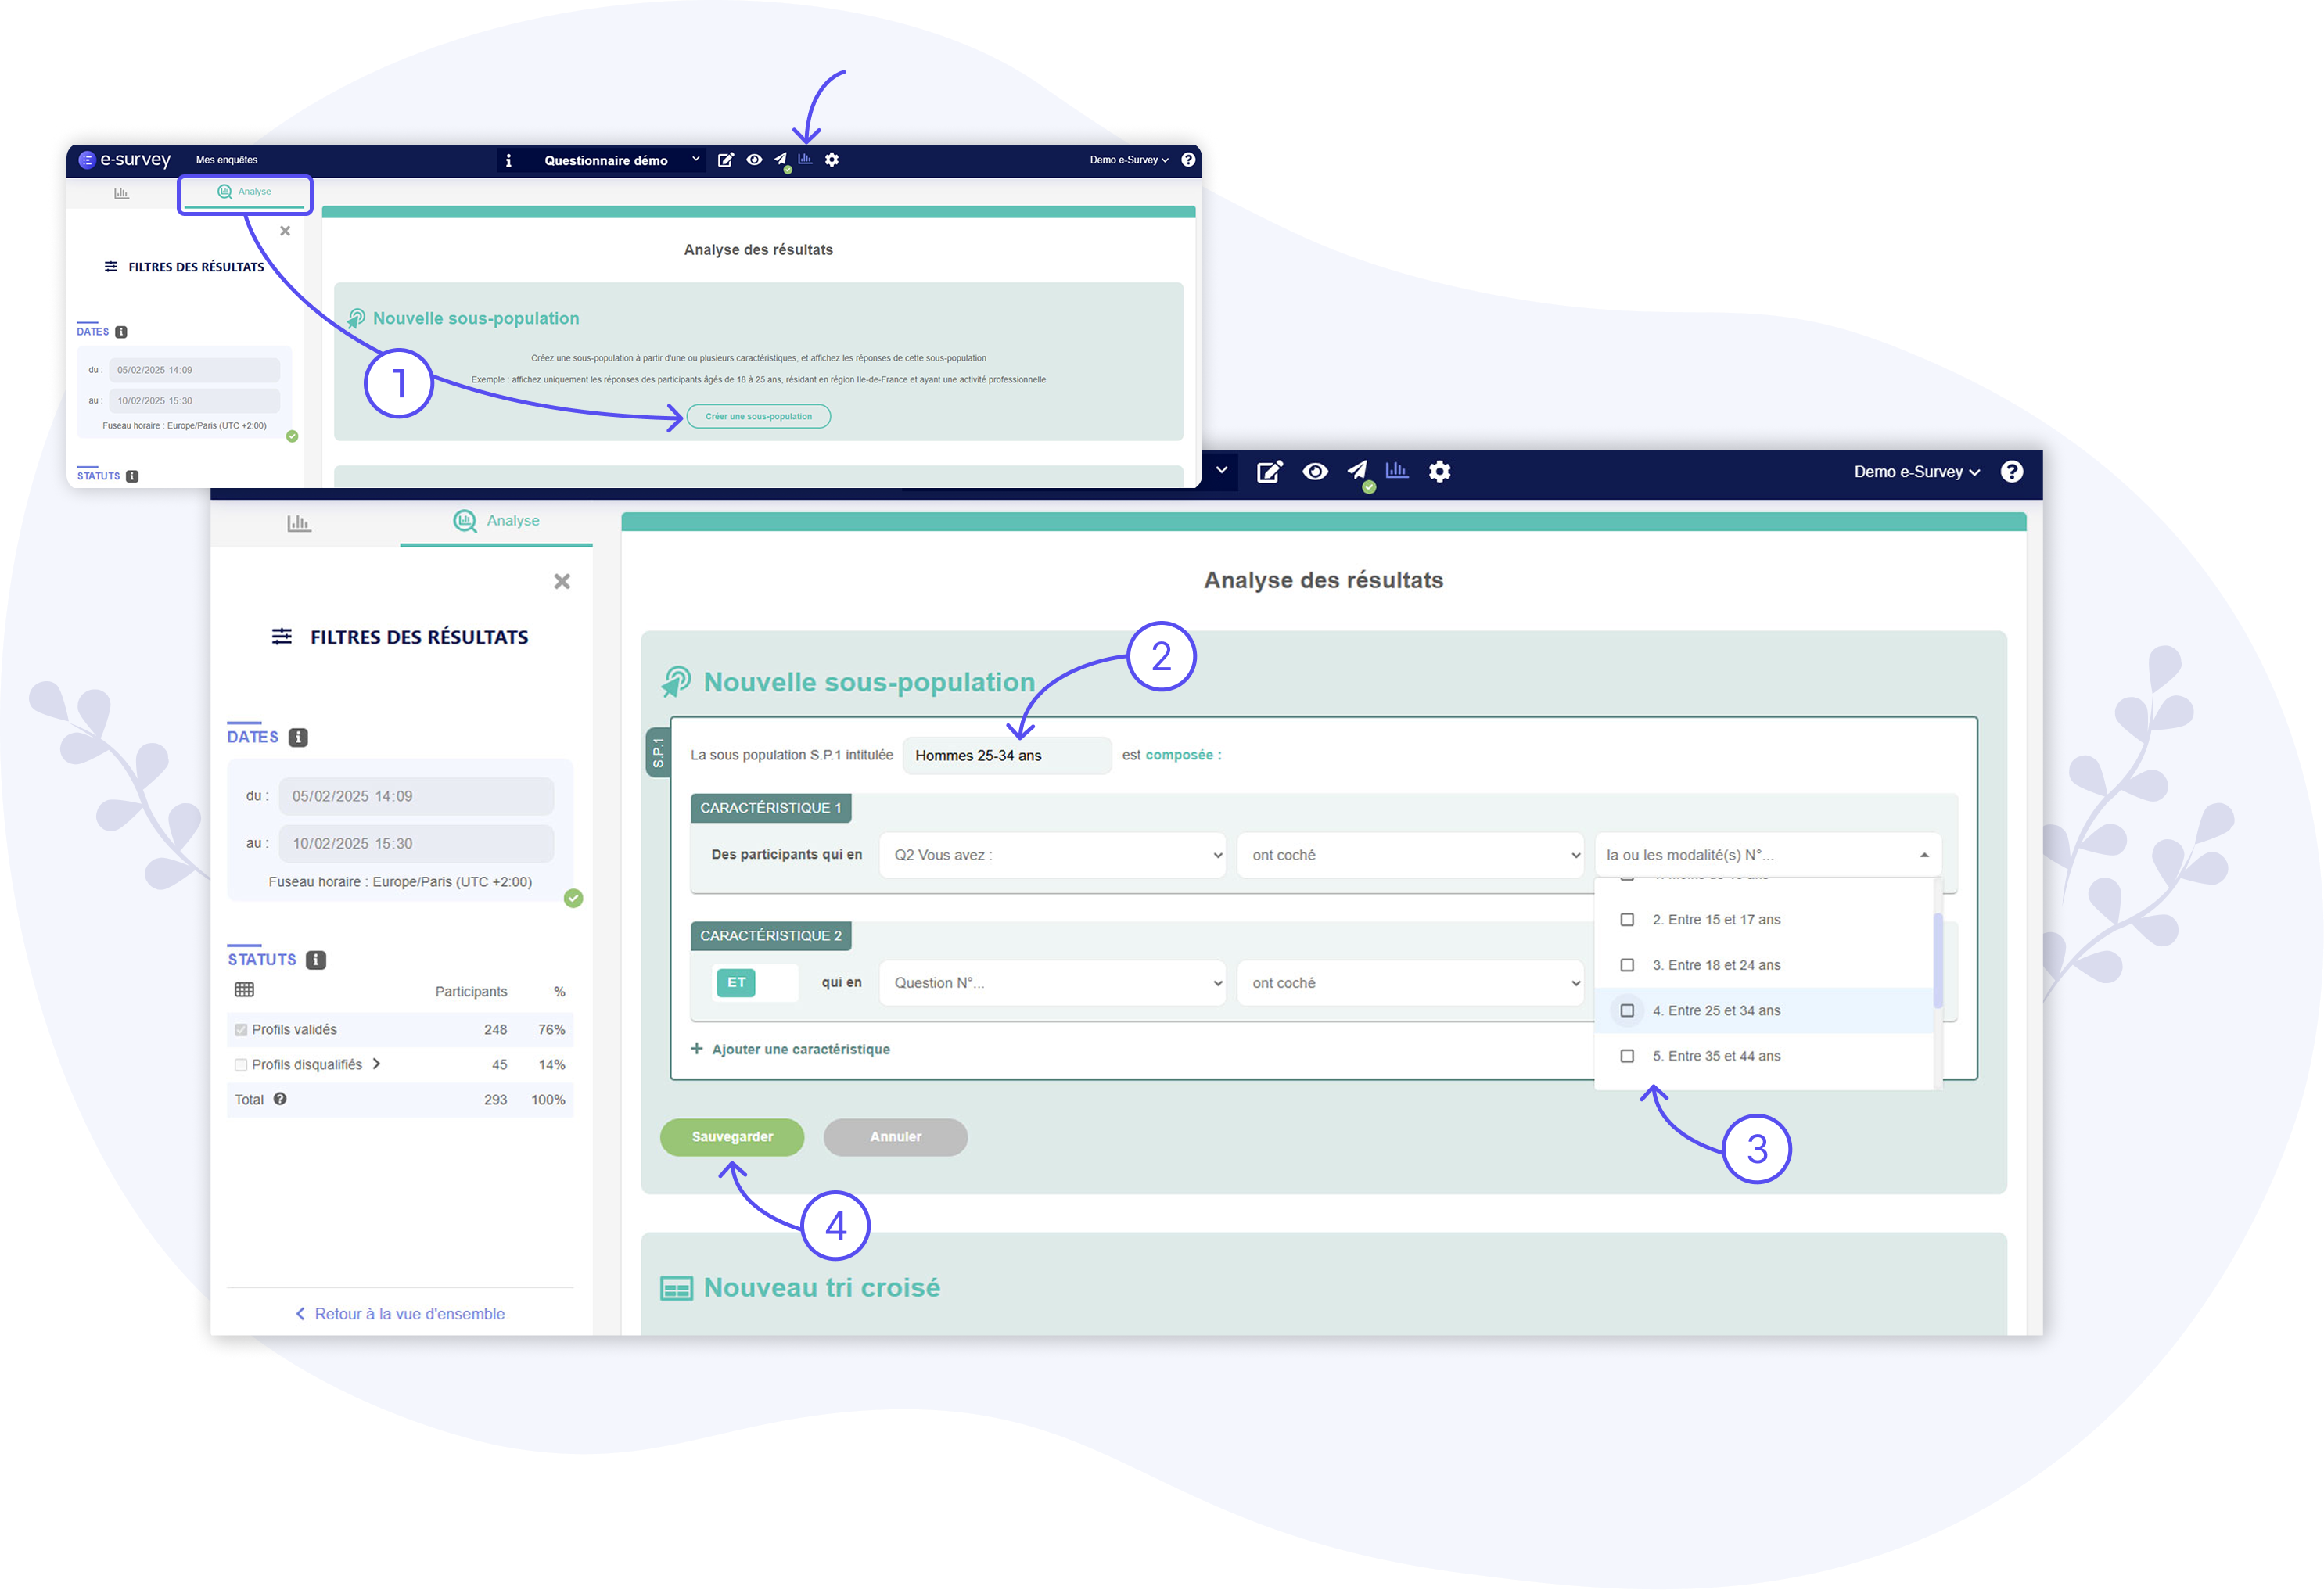
In the " Results Analysis " (or "Analysis") tab, you can both create Sub-populations and cross-reference the responses from several questions.
Click on the " Create a Sub-population " button to configure your first segment.
Start by giving your Sub-population a name (e.g., "Young 25–34").
Next, define the Sub-population's characteristics. For example, if the first characteristic of your
Sub-population concerns age (25–34), then select the question about age in your survey and tick the "25–34
years" range.
Then, if the second characteristic concerns professional activity (active individuals), select the question
about professional activity in your survey and tick only the "active" statuses.
And so on.
By default, respondents must meet ALL the characteristics of the Sub-population to be included (25–34 years AND "active" AND …). However, you can choose to replace the "AND" conditions with "OR" between characteristics, depending on your needs. For example, if you want to include young people aged 25 to 34 (active or not) OR active individuals (regardless of their age), the "OR" condition must be applied between the two characteristics: respondents meeting at least one of the two characteristics will be included in the Sub-population.
Once the Sub-population is created (and all its characteristics are configured), click on the "Save" button at the bottom of the section.
Start the analysis
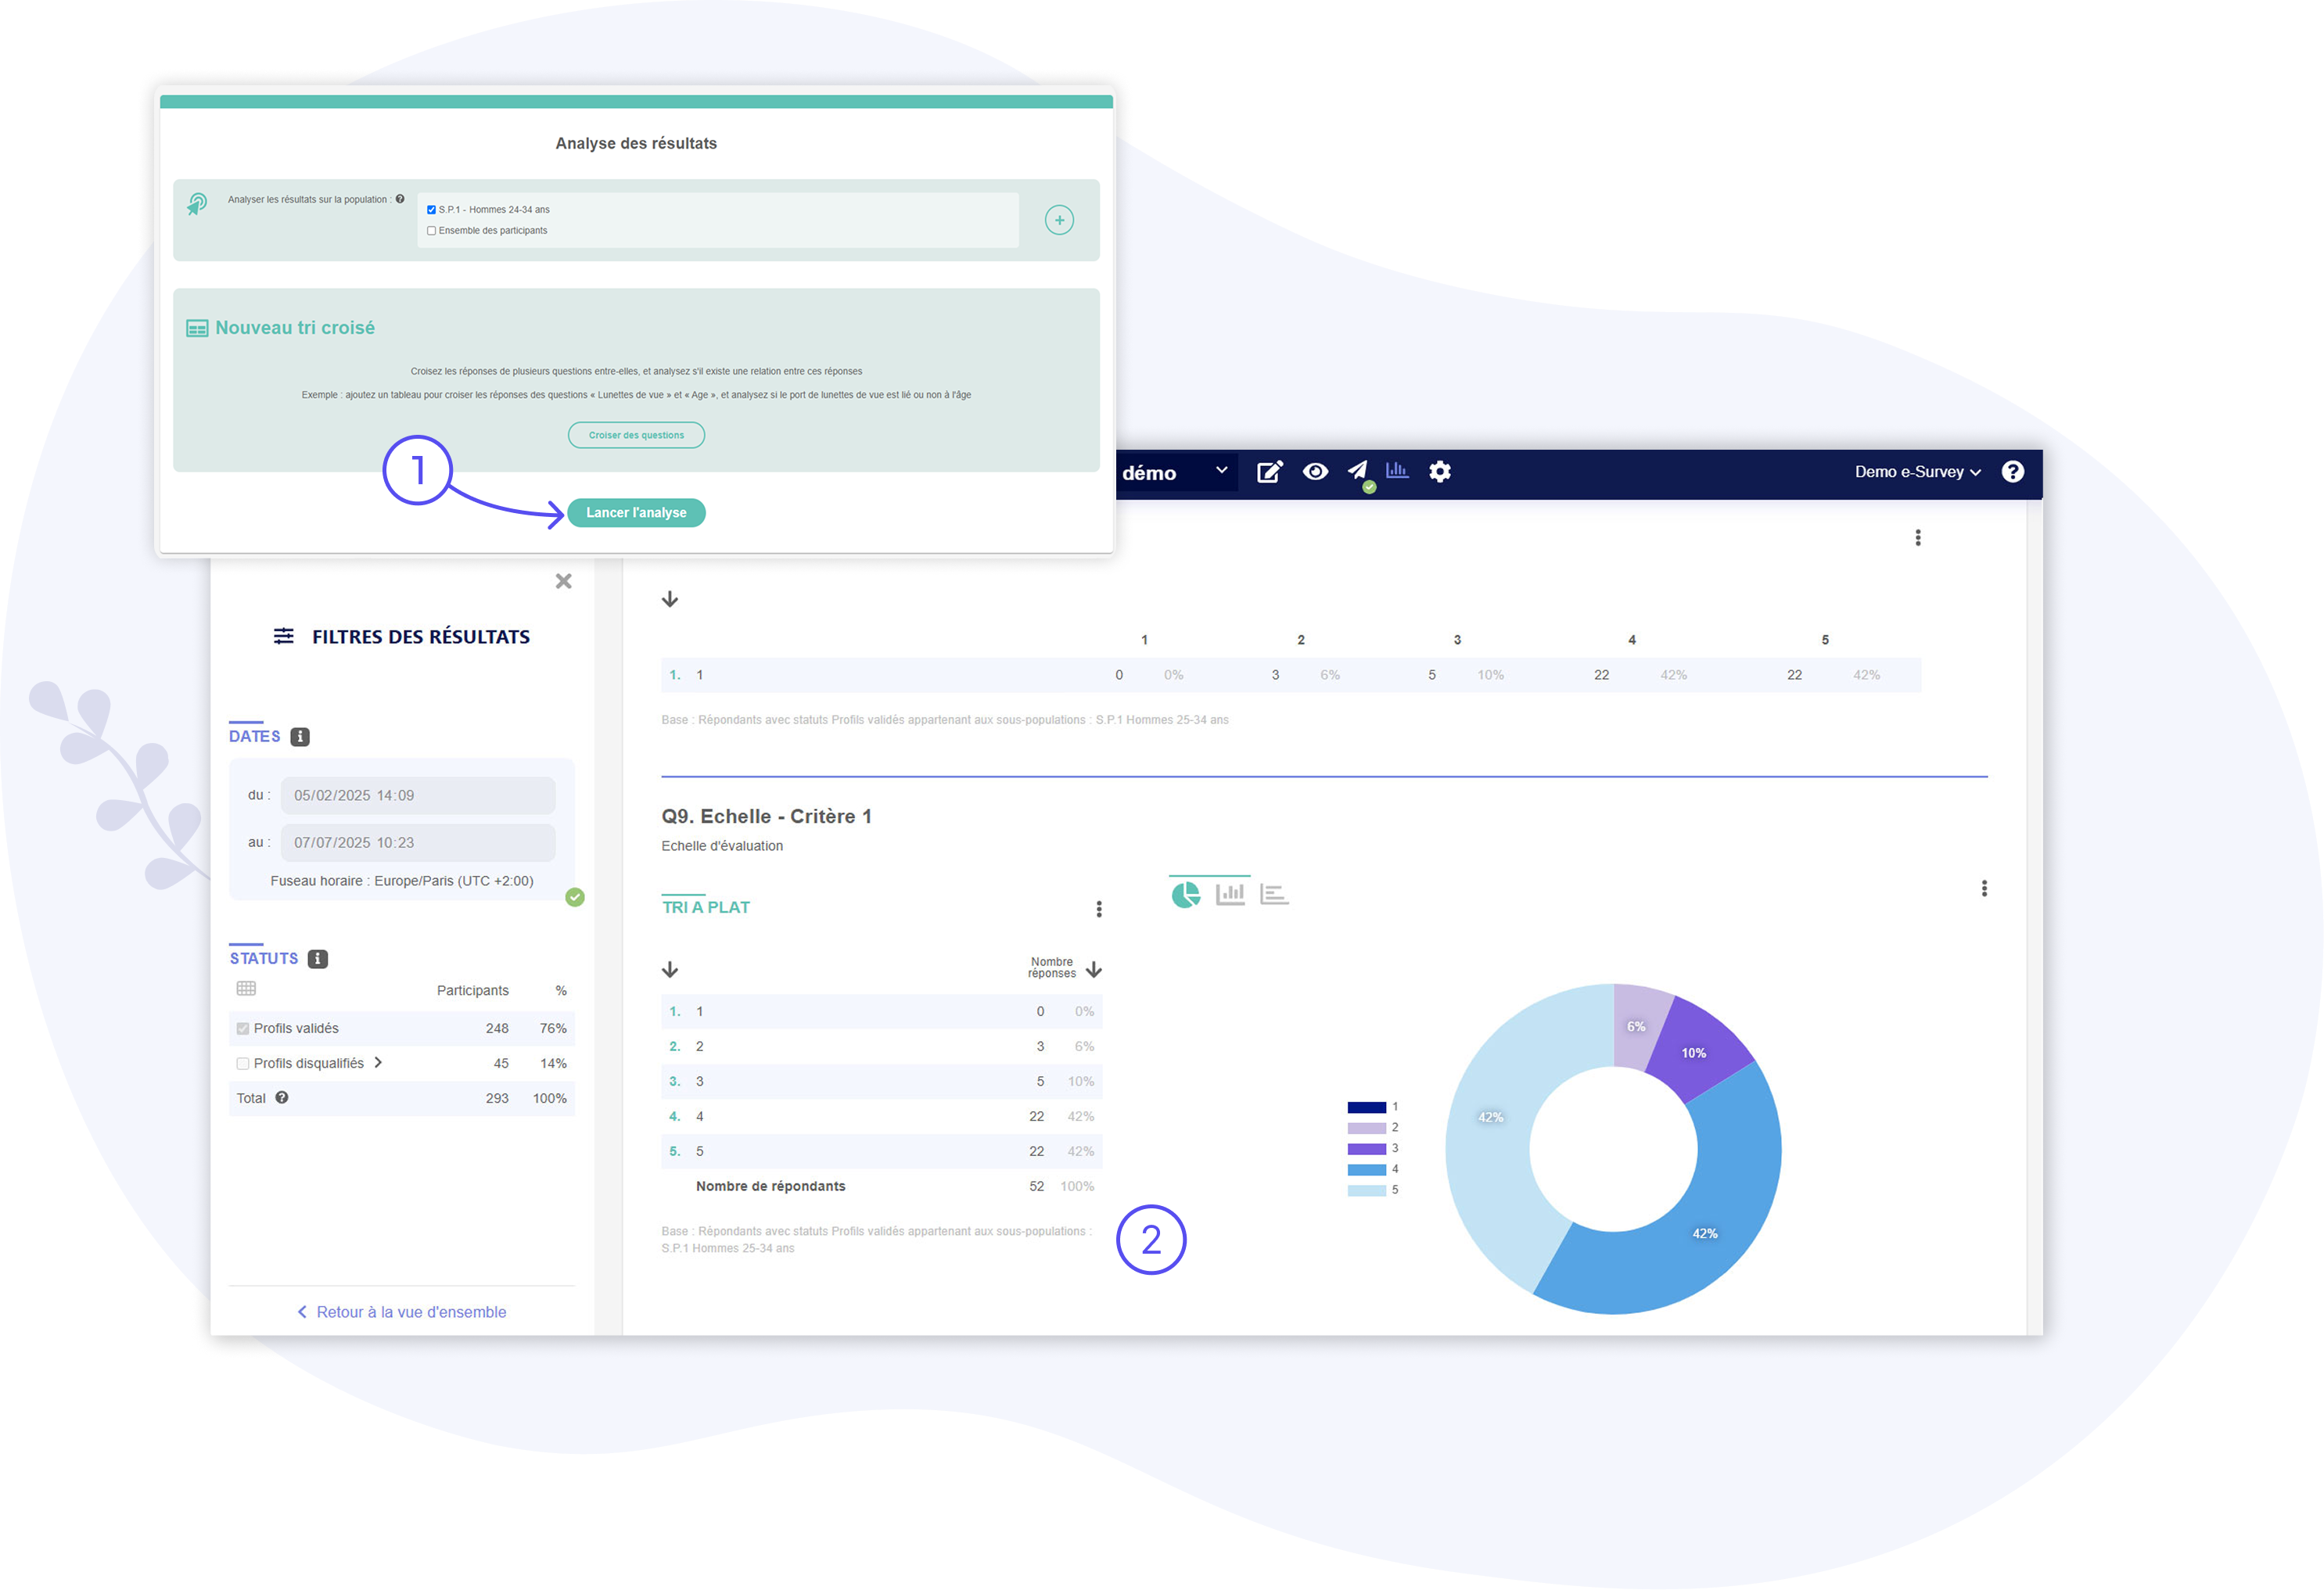
Once the Sub-population is created and saved, you can start an analysis to display the results for this segment by clicking the "Start Analysis" (or "Update Analysis") button.
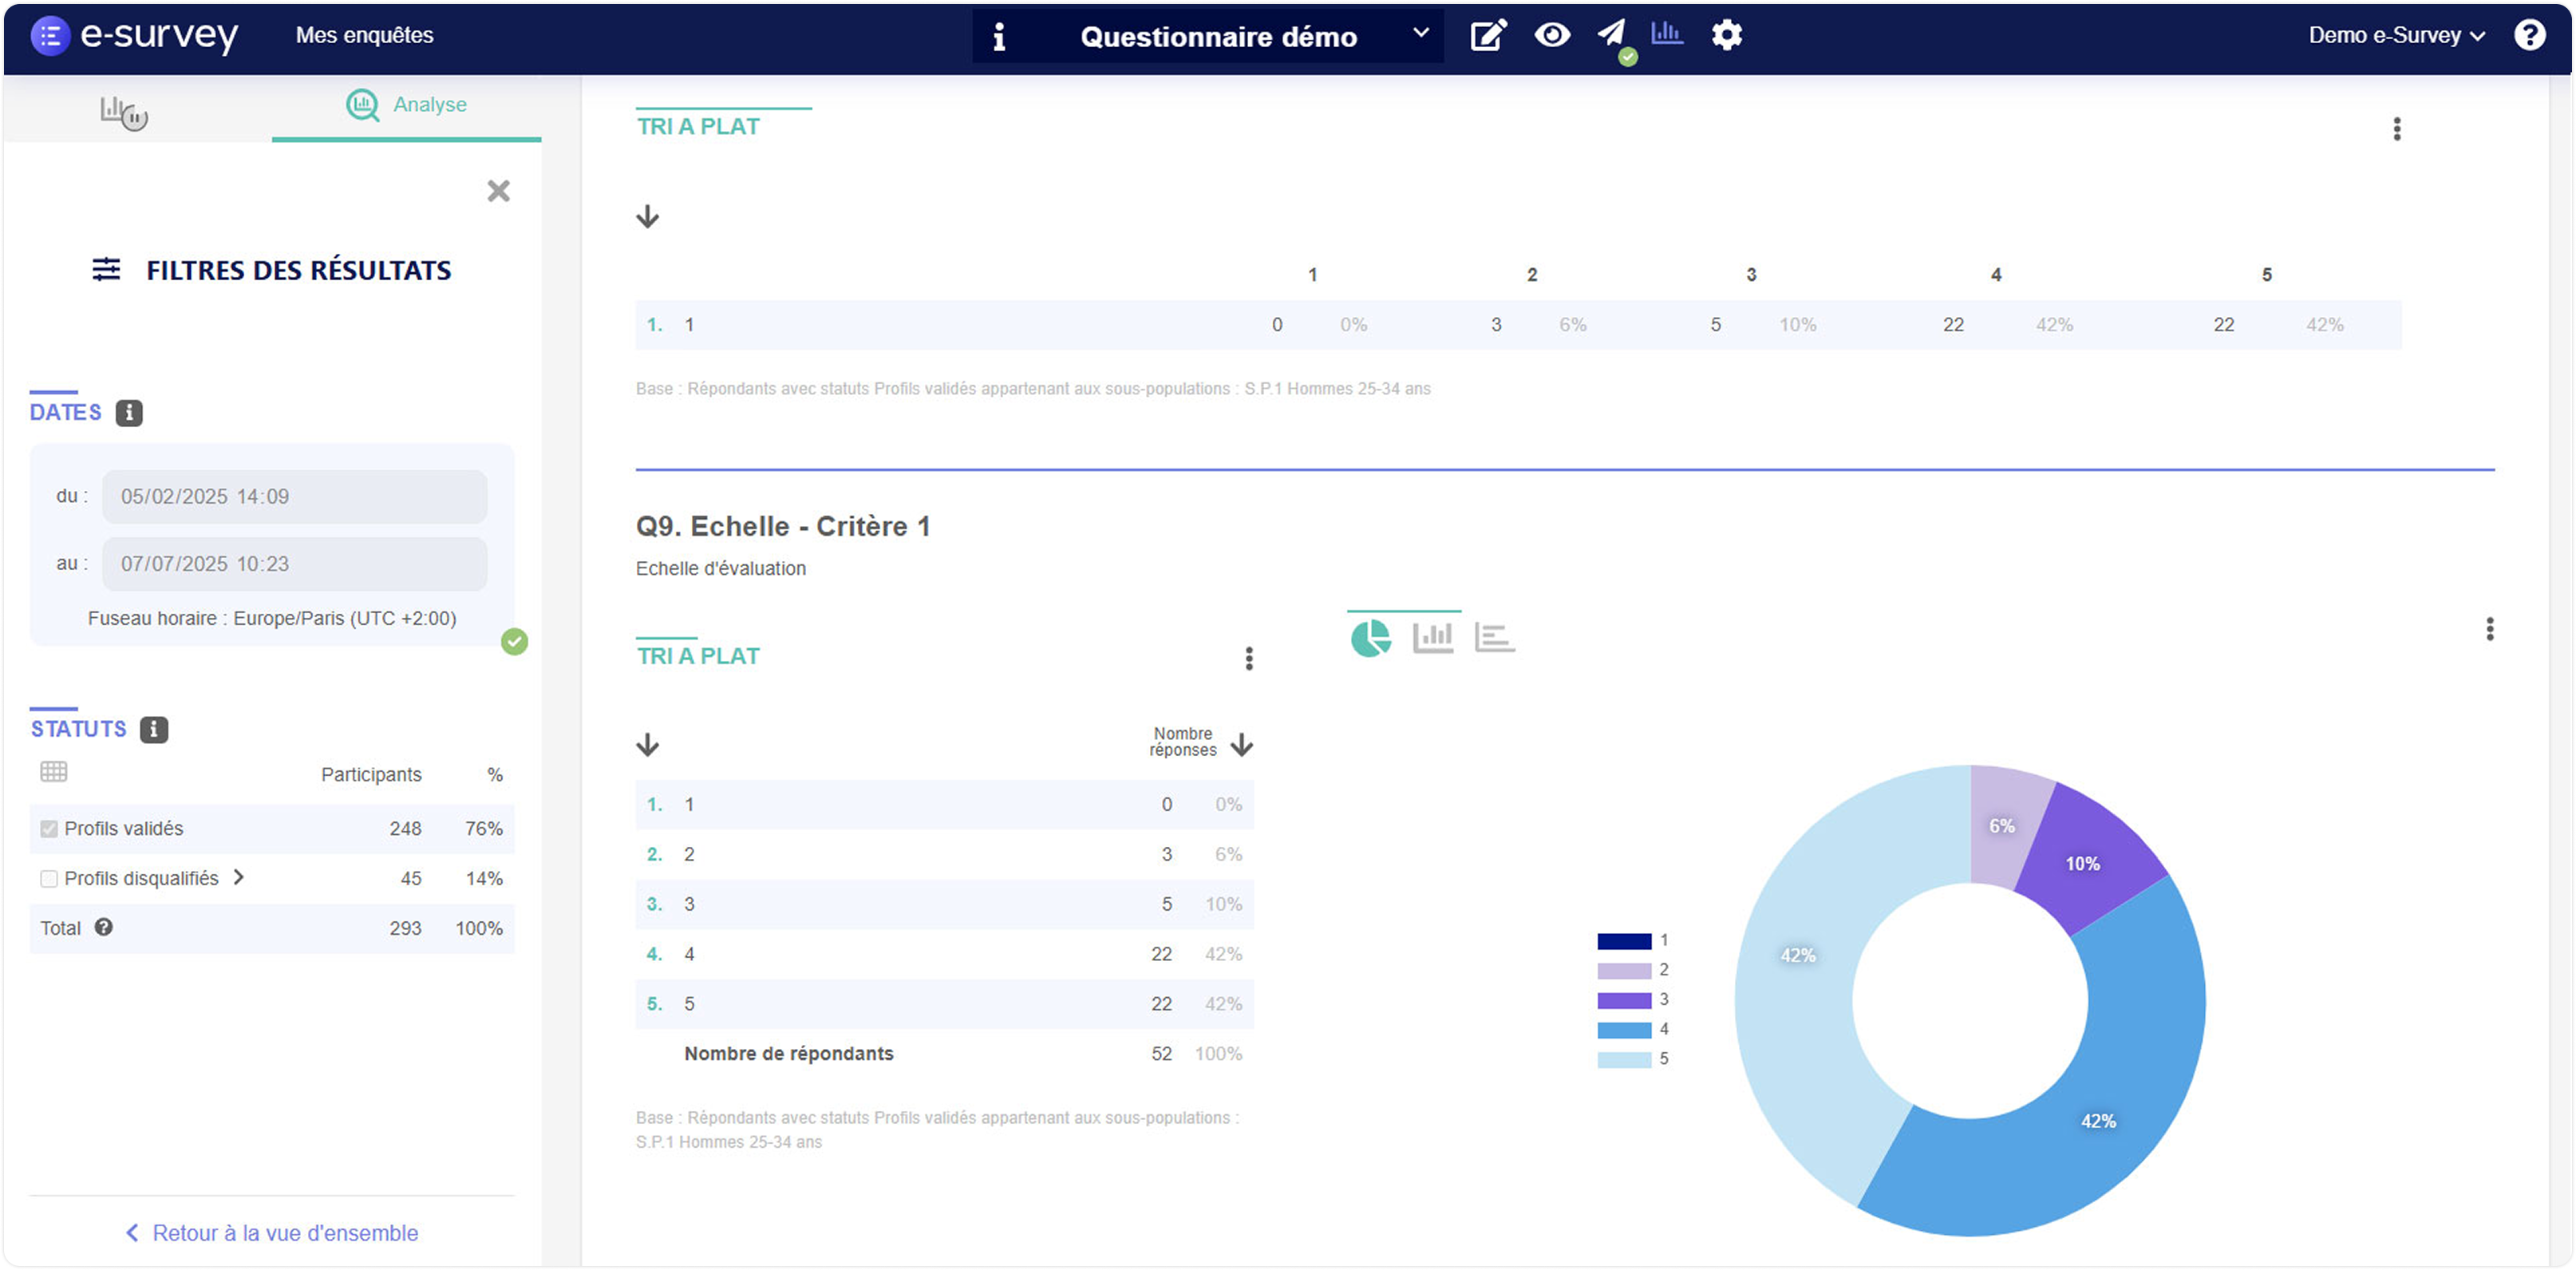
When the analysis is started, the tables and graphs load and display on the page. Of course, the results presented in these tables and graphs are calculated solely based on the answers of those who belong to the defined Sub-population (and thus meet its characteristics).
You can also create and start an analysis on multiple Sub-populations simultaneously.