Track the Collection: Dashboards
THE PERFECT TOOL TO SHARE FIELDWORK UPDATES AND REPORTS WITH STACKEHOLDERS
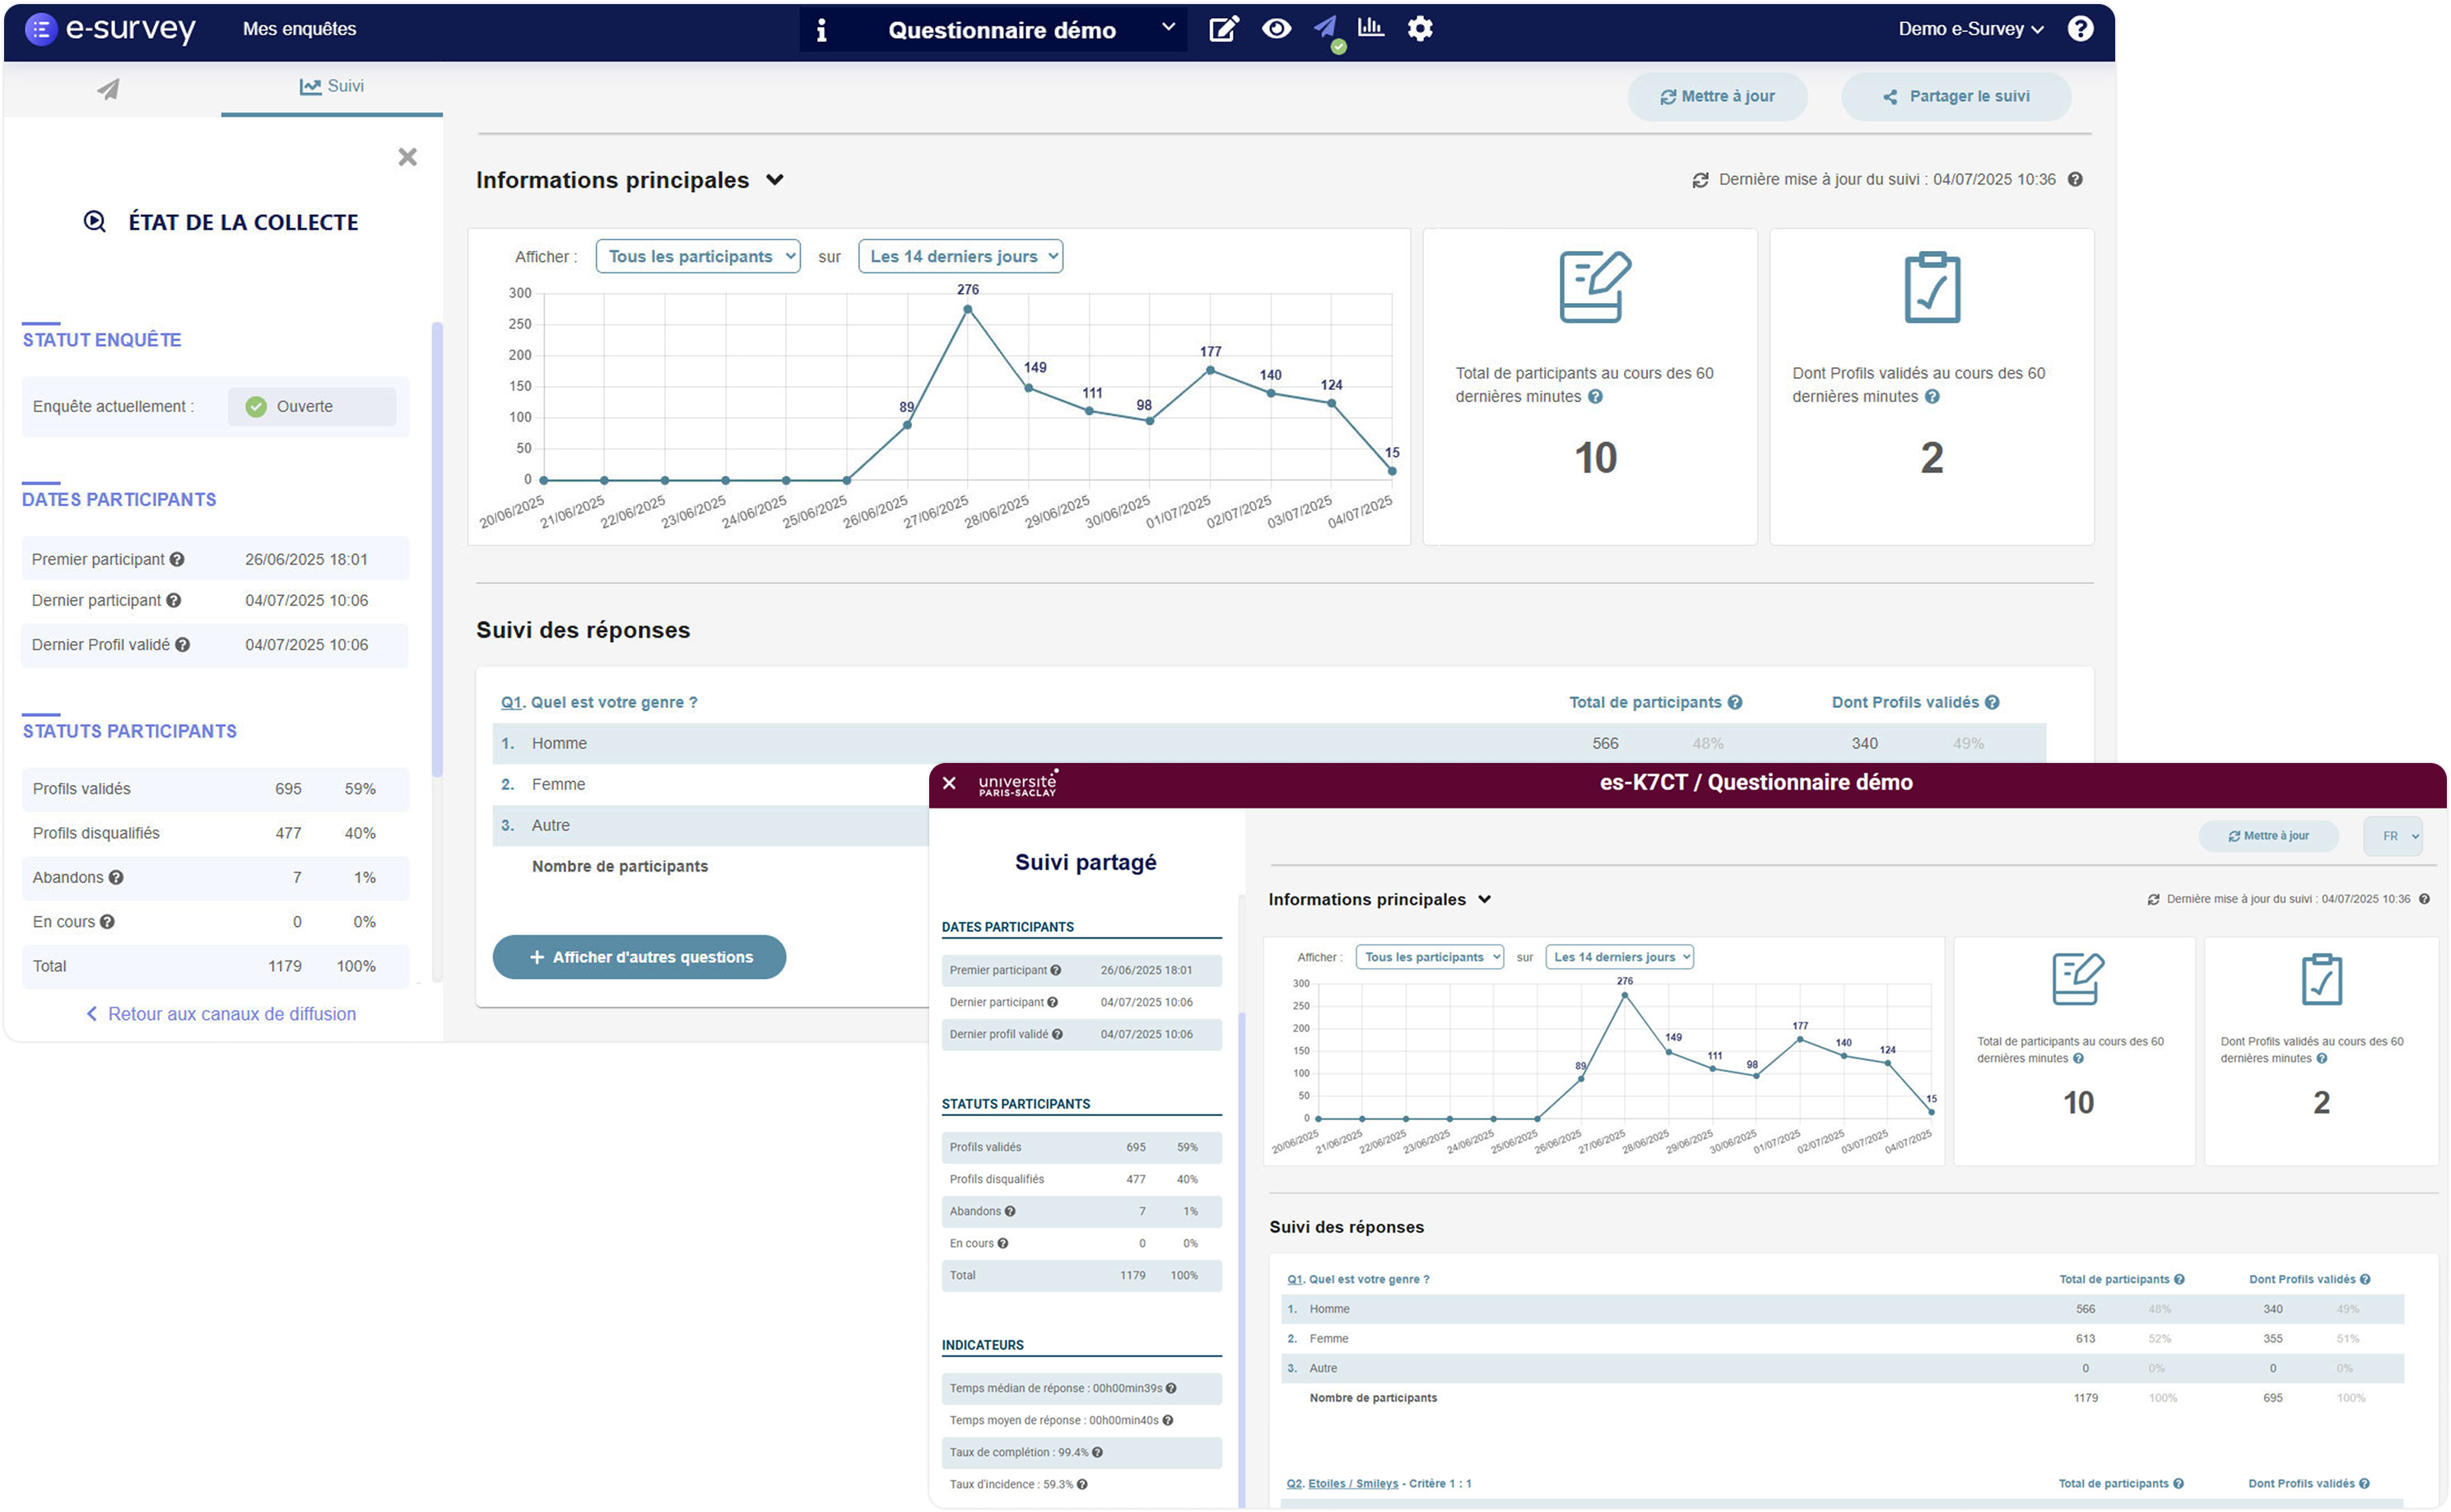
About Dashboards
Dashboards allow you to monitor survey collection in real-time: the number of respondents day by day, answers to
the most relevant questions, and more.
Each survey has its own dedicated Dashboard.
You can customize the Dashboard's appearance (logo, color, etc.) and grant access to selected individuals without
requiring them to create an account on the platform.
Dashboards make it easy to share survey progress and results with your teams (executives, managers, field teams,
etc.) and/or clients. It’s the perfect tool for survey reporting (progress, results, key indicators, etc.)!
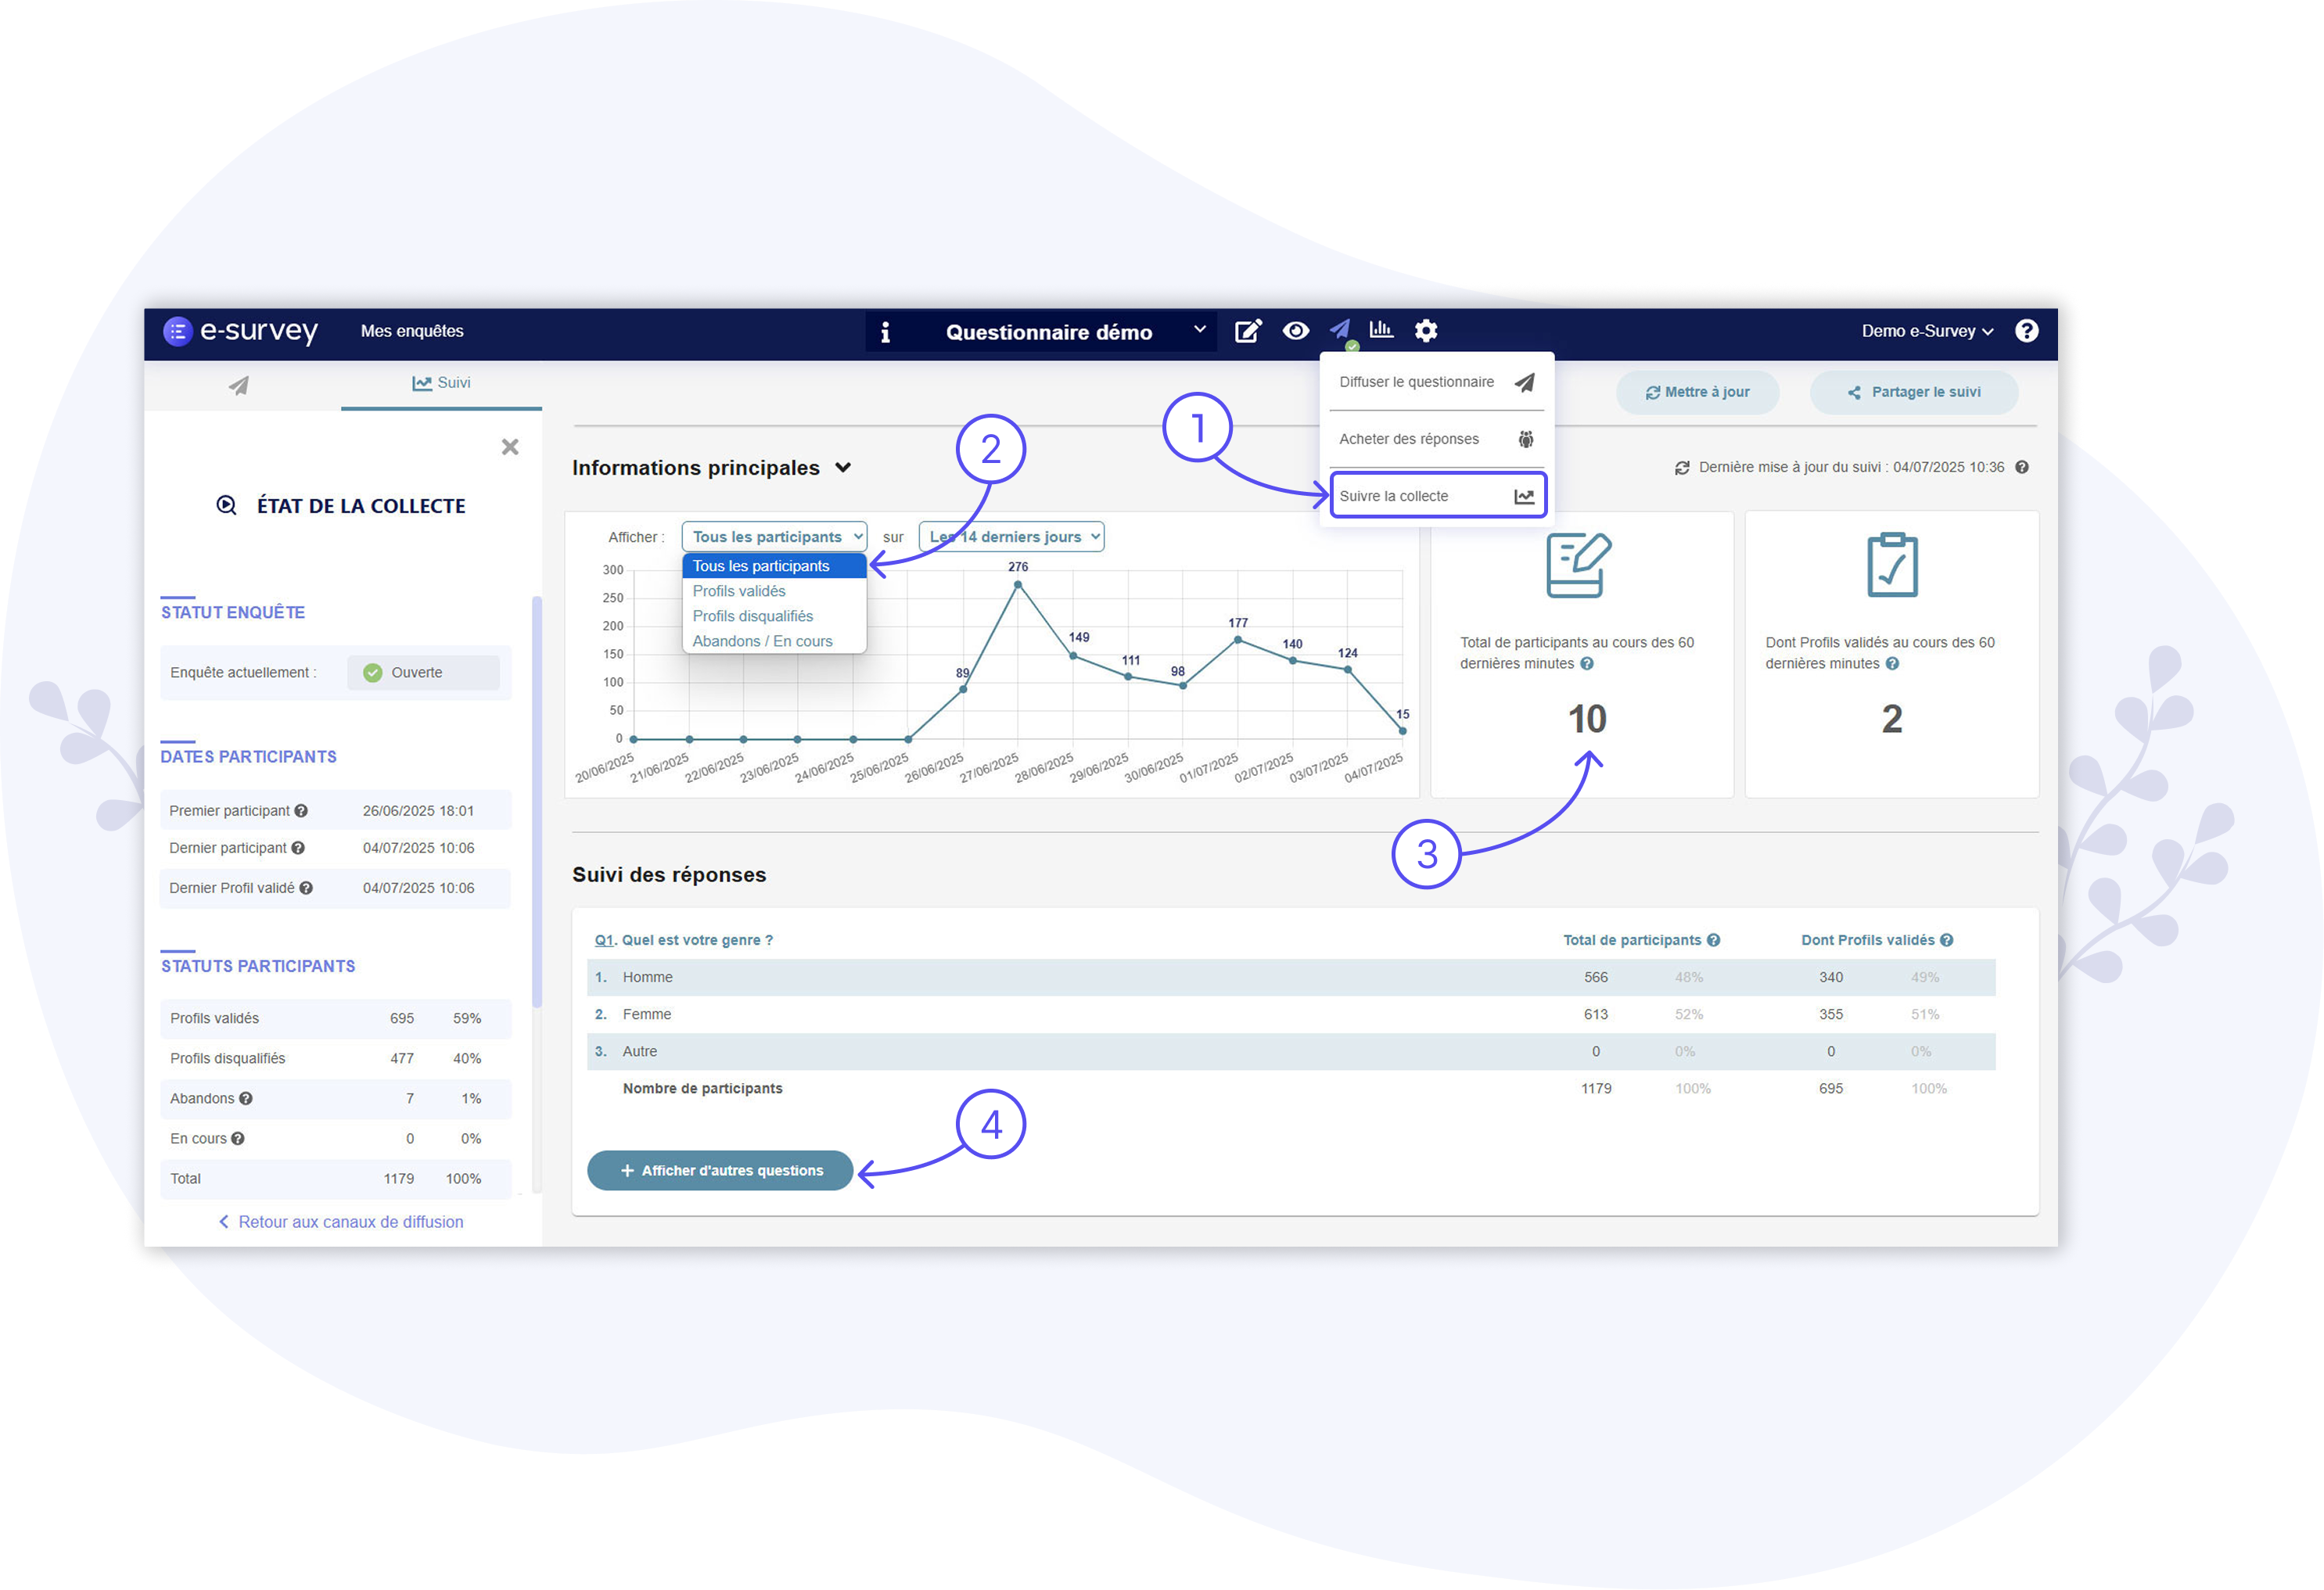
1 – Go to the “Track the Collection” tab
In the “Track the Collection” (1) tab (or « Tracking »), you can track responses in real-time.
On this page, you will find a primary graph displaying the number of respondents obtained day by day.
You can filter respondents by status (2) :
- All participants
- Only Validated Profiles
- Only Disqualified Profiles (Off-target profiles and Quota exceeded)
- Dropouts/In progress
This page also provides the number of respondents obtained in the last 60 minutes (3).
Finally, you can select specific questions to track in real-time by clicking on the “+ Show more questions” (4) button.
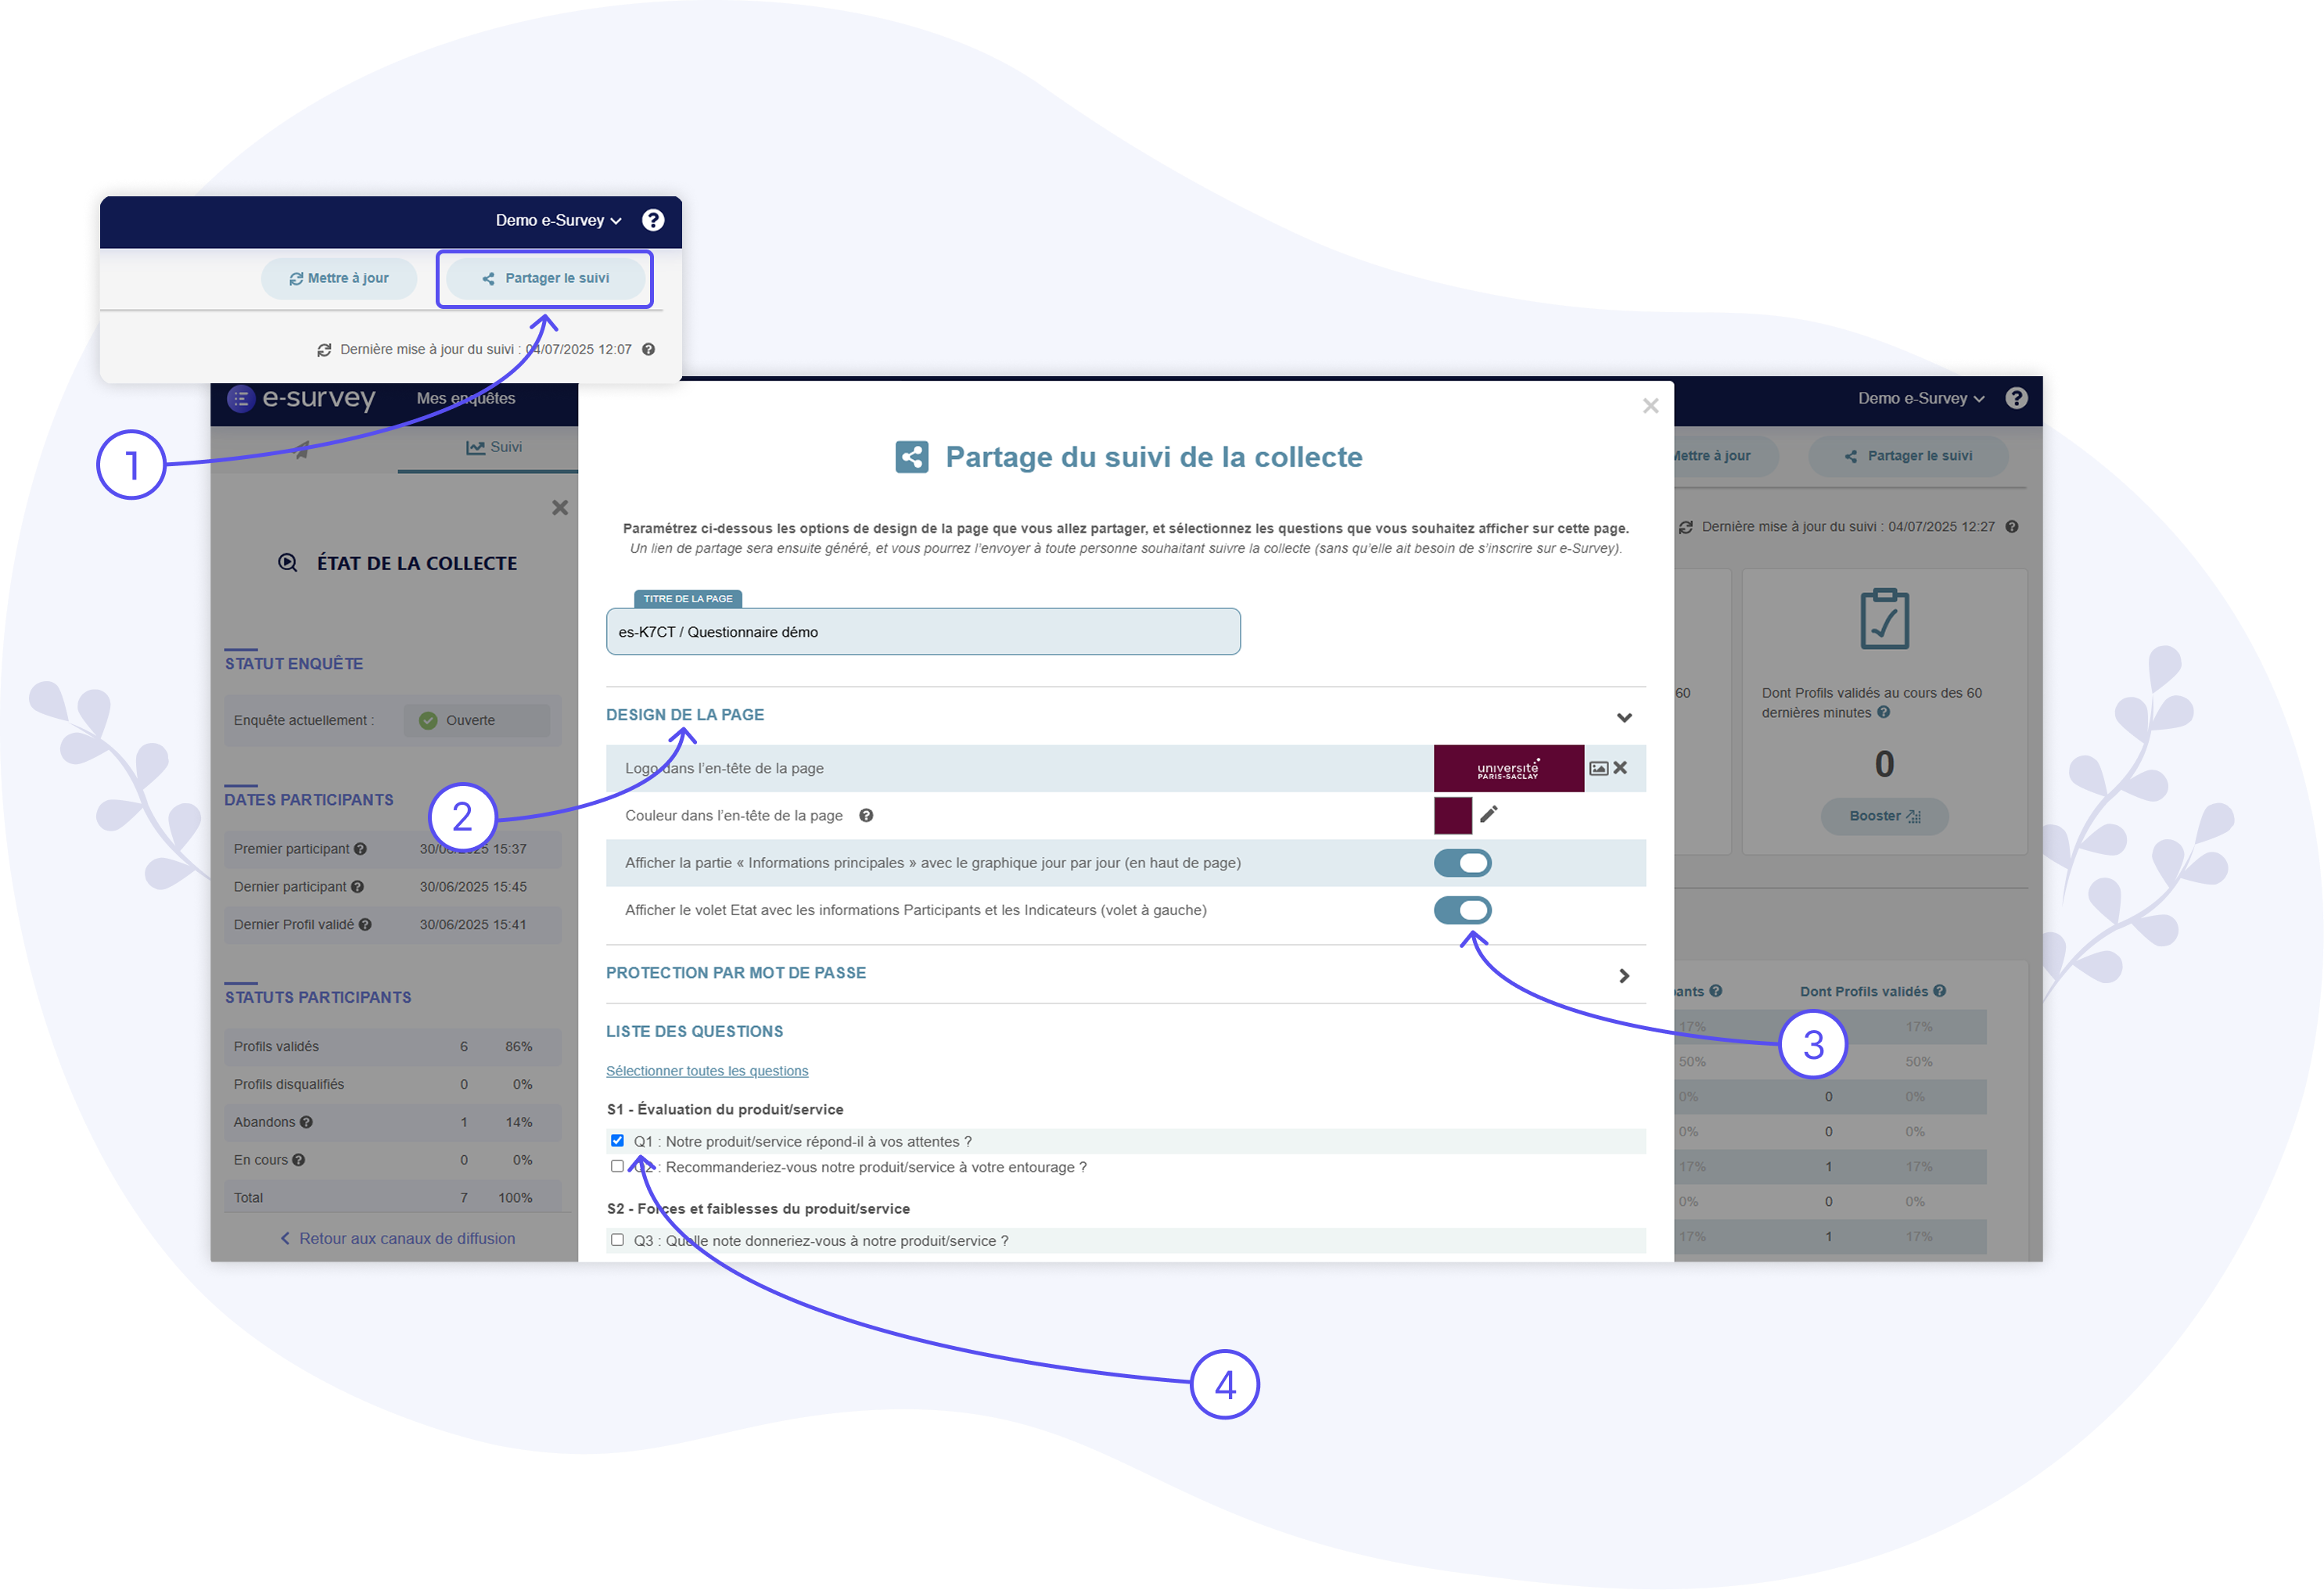
2 – Create the Shared Dashboard
Click on the “Share the Tracking” (1) button at the top of the page: a configuration window will then open.
From this window, you can customize the appearance and information you want to display on the dashboard you will share:
- You can add your logo and a color of your choice to the menu bar, which will appear in the header of the shared Dashboard (2).
- You can choose to show or hide the graph displaying the number of respondents per day, as well as specific collection indicators (e.g., median response time, average response time, completion rate, incidence rate, etc.) (3).
- Then, you need to select the questions for which the answers will be visible on the shared Dashboard (the recipients of the dashboard will then be able to monitor responses to these questions in real-time) (4).
3 - Add a Password to the Shared Dashboard (Optional)
You can choose to add a strong password to secure access to the shared Dashboard (1).
The password you create must include at least (2) :
- 8 characters
- 1 uppercase letter
- 1 lowercase letter
- 1 number
- 1 special character
Thus, anyone receiving the link to the Dashboard must enter the password to gain access (3).
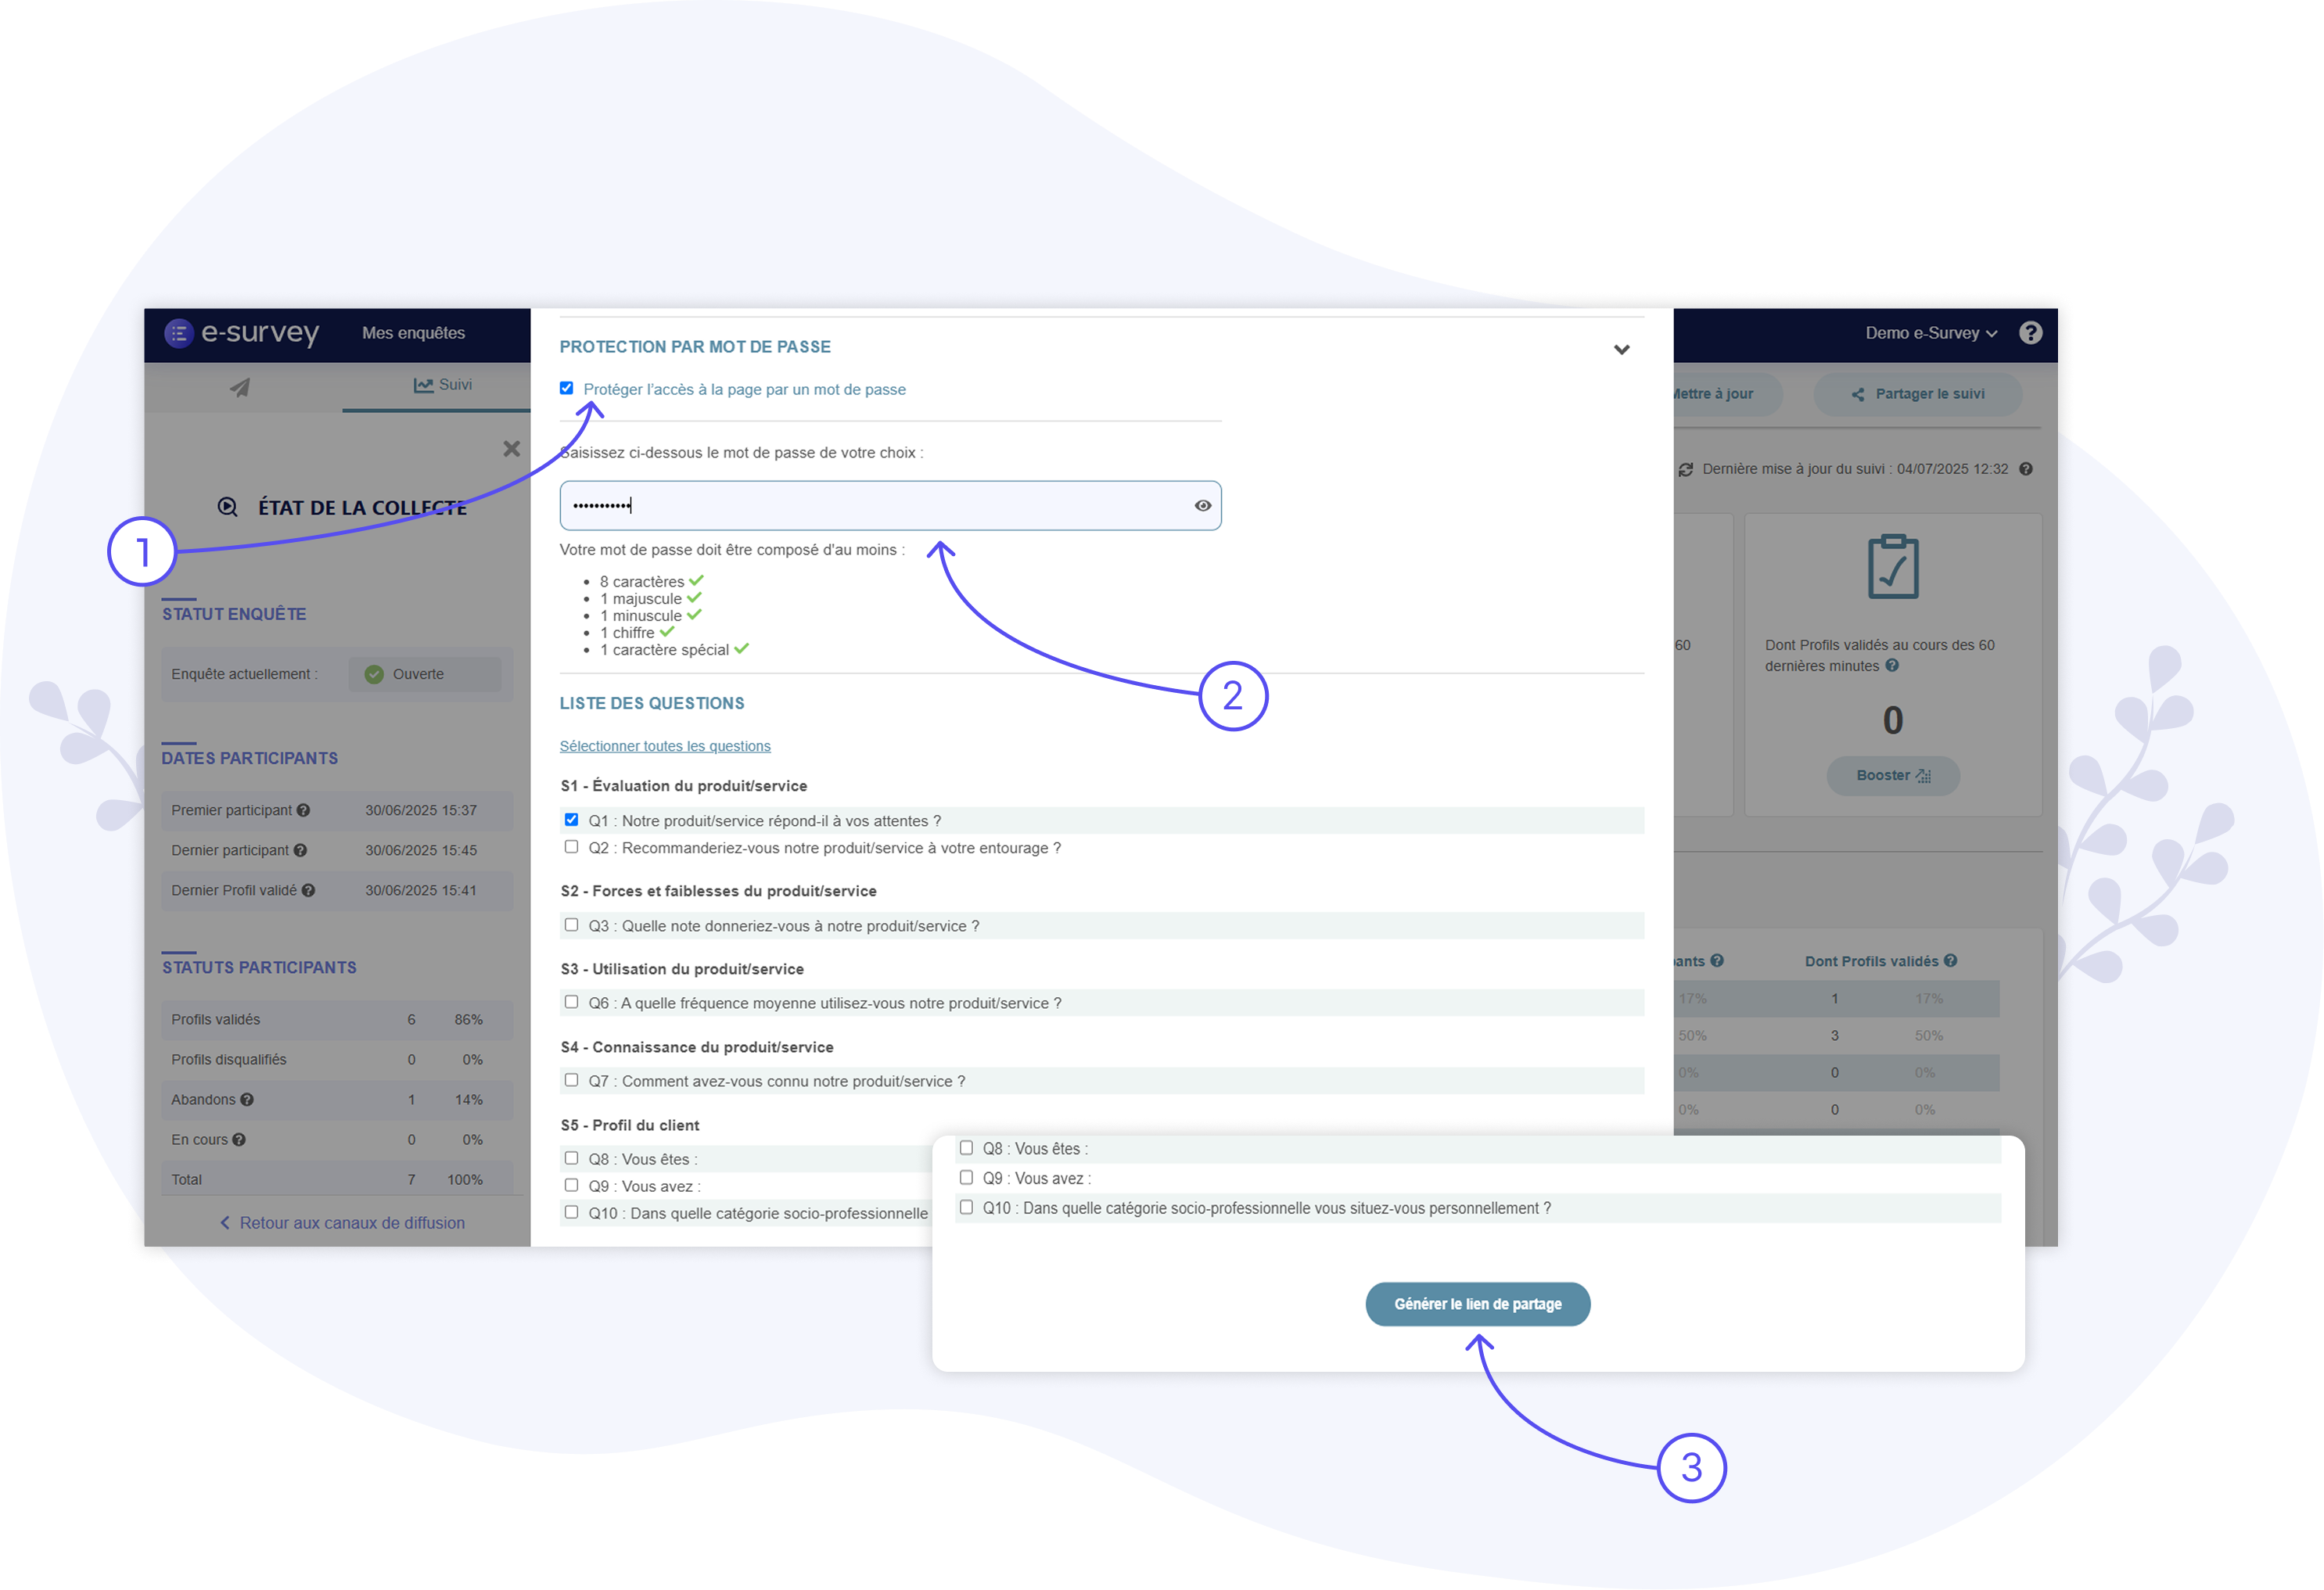
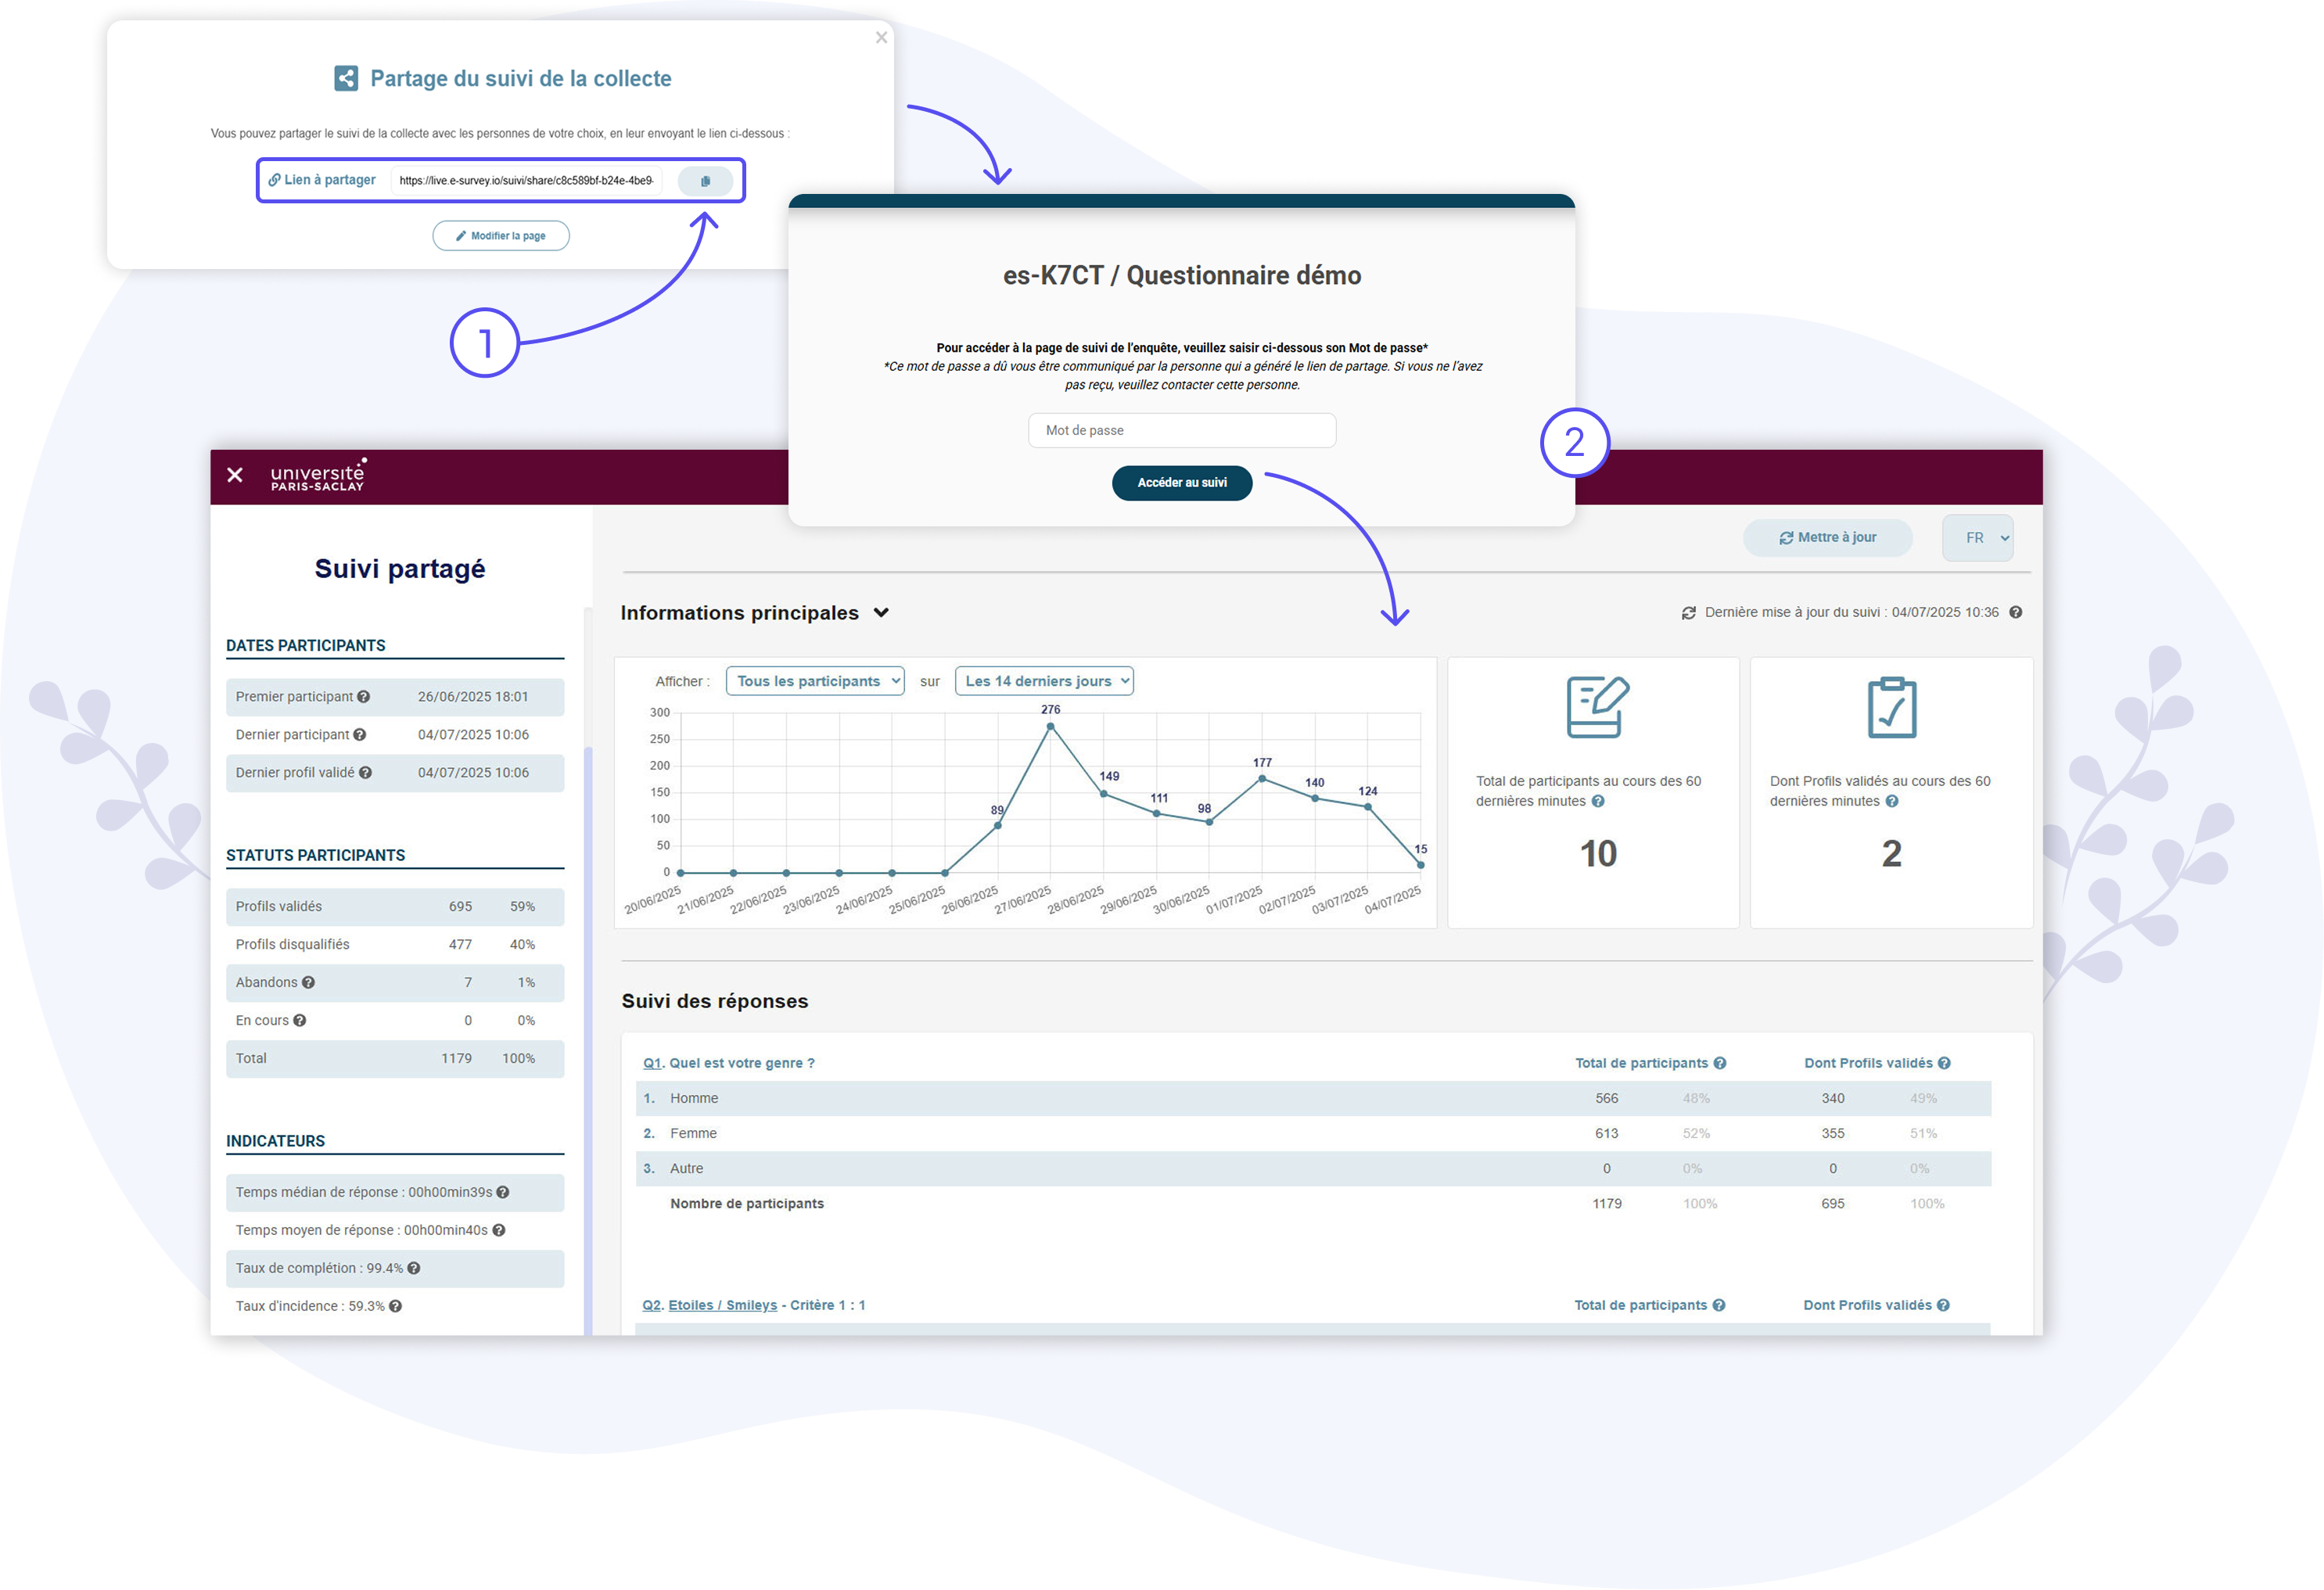
4 – Send the Access link to the Shared Dashboard
The last step to share the Monitoring Dashboard, and thereby enable selected individuals to view it, is naturally to send them the URL link to the Dashboard (1).
Anyone receiving the access link can view responses in real-time (only for the questions you preselected).
The individuals with whom you share the Dashboard do not need to register on the platform. Anyone who receives the link can access the survey monitoring, simply by clicking on the link (and entering the password, if you have added one) (2).